Download
1 / 1
10 likes | 185 Vues
s. s. s. N(s). N(s). N(s). log(1/ s ). log(1/ s ). log(1/ s ). log (N(s)). log (N(s)). log (N(s)). 50. 50. 50. 24. 7. 117. -1.699. -1.699. -1.699. 2.068. 1.380. 0.845. 25. 25. 25. 397. 13. 96. -1.398. -1.398. -1.398. 2.599. 1.982. 1.114. 12. 12. 12.

E N D
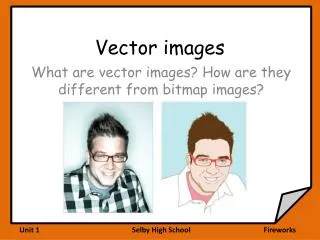
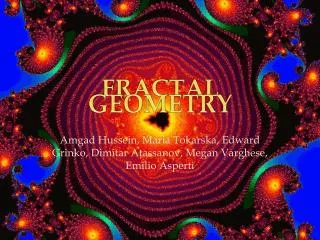
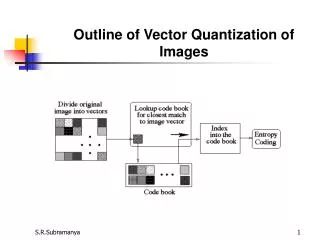
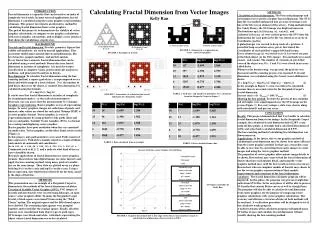
s s s N(s) N(s) N(s) log(1/s) log(1/s) log(1/s) log(N(s)) log(N(s)) log(N(s)) 50 50 50 24 7 117 -1.699 -1.699 -1.699 2.068 1.380 0.845 25 25 25 397 13 96 -1.398 -1.398 -1.398 2.599 1.982 1.114 12 12 12 1414 322 25 -1.079 -1.079 -1.079 1.398 2.508 3.150 6 6 6 50 1242 5107 -0.778 -0.778 -0.778 1.699 3.708 3.094 3 3 3 4968 19333 98 -0.477 -0.477 -0.477 1.991 3.696 4.286 Calculating Fractal Dimension from Vector ImagesKelly Ran INTRODUCTION Fractal dimension is a quantity that can be used as an index of complexity for fractals. In most research applications, fractal dimension is calculated using the raster graphics representation of images. This project investigates an alternative method by calculating fractal dimension from vector graphics. The goal of this project is to demonstrate the viability of vector graphics calculations, to compare vector graphics calculations with raster graphics calculations, and to display a user interface that shows the calculations, step-by-step. METHODS Calculation of fractal dimension. The Processing language and environment were used to calculate fractal dimension. The SVG data file was loaded and parsed into an array of strings (each line of the file was an element of the array). Using methods from the Candy library, the SVG image was displayed onscreen. The functions split(String s), trim(), and indexOf(String s) were used to process the SVG data file. Information for each path in the file was stored as an array of Coordinates, paths. A global integer was created to keep track of s, grid size. A nested for-loop created an array, grid, that stored the Coordinates of each grid box’s upper-left hand corner. Every element in grid was tested to see if it covered any part of the black object (in the SVG image). Two methods were used: case1 and case2. The number of elements in grid that covered the object was N(s). S and N(s) were stored in an array called data. Whenever the button step was pressed, the grid size was decreased and the counting process was repeated. D, fractal dimension, was calculated using the 2 most recent additions to data: D = [log(N(s2)) – log(N(s1))] / [log(1/s2) – log(1/s1)] (2) In the example in Figure 3, error was able to be calculated, because there is an actual value for the Sierpinski Carpet’s fractal dimension. Percent error = |D - Dactual| * 100 / Dactual (3) Showing the box method. To show the process of box-counting, red rectangles were superimposed over the SVG image on the screen (Figure 3). For every unique s, data were shown, along with calculated D and percent error. BACKGROUND Fractals and fractal dimension. Fractals, geometric figures that exhibit self-similarity, are used in myriad applications. They accurately model many natural objects and phenomena, like tree branches, jagged coastlines, and particle motion. Every fractal has a numeric fractal dimension that can be calculated using several methods. Researchers use fractal dimension as an index of complexity: it is used for texture classification in computer vision, protein molecule analysis in medicine, and plant growth analysis in botany. Box dimension. To calculate fractal dimension using the box-counting method, a square grid of size s is superimposed over a black-and-white image of a fractal object. N(s), the number of grid boxes that cover the object, is counted. Box dimension D is calculated using the formula . D = log(N(s)) / log(1/s) (1) It can be seen that fractal dimension is an index of complexity by examining formula 1: as the scale of measurement s decreases, one can assess how the measurement N(s) changes. Graphics representation. Raster graphics is way of representing images. In raster graphics, images are collections of pixels, and numeric color values are stored for each pixel. Bitmap (BMP) is a raster graphics format. Vector graphics is a way of representing images by using primitives like paths (lines and curves) and points. Scalable Vector Graphics (SVG) is a format for creating and displaying vector graphics. Raster graphics have poor resolution when they are examined on small scales. Vector graphics, on the other hand, retain clarity (Figure 2). In this project, only path primitives were used. Paths consist of lines and curves. Path data is usually stored in a single attribute, and consists of commands and coordinates: d="M 200,66 L 266,66 L 266,133 L 200,133 L 200,66 z “ Commands such as M, L, C, and z indicate what kind of line or curve should be drawn. Research applications of fractal dimension use raster graphics formats. Researchers take digital images (in raster format) and apply the box-counting method, using many grids of variable size on the same image. Their data are plotted on an x-y plane, with log(N(s)) on the y-axis and log(1/s) on the x-axis. Using a linear regression, they find the line of best fit for the data, and D is the slope of that line. (a) Vector graphics image (b) Raster graphics image (a) Sierpinski Gasket D ≈ 1.59 (b) Sierpinski Carpet D ≈ 1.89 FIGURE 2. Zooming in: a comparison of vector and raster graphics FIGURE 1. Examples of fractals (a) s = 12 (b) s = 3 TABLE 1. Grid size s and number of grid boxes N(s), calculated from the Sierpinski Carpet in Figure 3 FIGURE 3. Screenshots of calculating the fractal dimension of a Sierpinski Carpet CONCLUSION Results. This project demonstrated that it is feasible to calculate fractal dimension from vector images. In the Sierpinski Carpet example, the calculated fractal dimension had 4.238% error, using all data points. A rectangle had a calculated dimension of 1.874, and a line had a calculated dimension of 0.939. The box-counting method of calculating fractal dimension was shown onscreen. Applications. In the future, this vector graphics method of calculating fractal dimension may be shown to be more efficient than the raster graphics method. In that case, researchers may be able to save time by converting their raster images to vector images and using the vector graphics method. The properties of vector graphics allow minute image details to be shown. Researchers may want to find the fractal dimension of objects that have such minute detail, and using the vector graphics method may yield the best results in terms of accuracy. Researchers who use computer models of fractals may choose to use the vector graphics representation of their models. Improvements and extensions of the fractal dimension calculator. The fractal dimension calculator program will be improved. In this phase, the program can process straight-line paths from SVG files. In the next phase, it will be able to process SVG paths that contain Bézier curves as well as straight lines. The program will also be able to calculate fractal dimension from raster graphics, for the purpose of comparing raster graphics calculations with vector graphics calculations. The accuracy and efficiency (in terms of time) of both methods will be analyzed. A verification procedure will be designed to test if the calculator works properly. A useful extension of the calculator program will upload many SVG files at once and calculate fractal dimension without visually showing the box-counting method. TABLE 2. Datacalculated from a rectangle TABLE 3. Data calculated from a line Sierpinski Carpet Linear regression Slope = 1.8099 R2 = 0.9995 Error = 4.238% Rectangle Linear regression Slope = 1.874 R2 = 0.990 Error = 6.300% Line Linear regression Slope = 0.939 R2 = 0.9993 Error = 6.100% METHODS This presentation uses an example of a Sierpinski Carpet to demonstrate the methods of the fractal dimension calculator. Creation of Scalable Vector Graphics (SVG). SVG images of fractals and non-fractals were created using Inkscape, an open source vector graphics editor. To make the Sierpinski Carpet fractal, a black square was cloned 9 times using the “Tiled Clones” option. The original square and the fifth cloned square were deleted. The remaining eight squares were grouped together and treated like the original square. Finally, all of the squares were transformed from object types to path types. SVG images were black-and-white, with black representing the object whose fractal dimension was to be calculated. All figures and tables by Kelly Ran FIGURE 4. Graph of data from Table 1. The slope of the linear regression line is equal to calculated fractal dimension. Percent error is 4.238%.