Download
1 / 20
200 likes | 365 Vues
The Goldilocks principle – too much, too little, or just right?. John Hackston, OPP Ltd Swati Kanoi, University of Oxford. Getting it just right. Using non-linear relationships. Danger-zone profiles. Ideal profiles and profile matching. Qualification grids. The study.

E N D
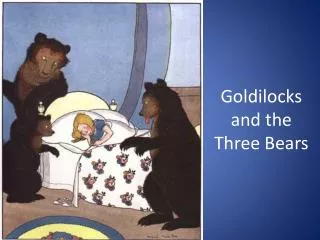
The Goldilocks principle – too much, too little, or just right? John Hackston, OPP Ltd Swati Kanoi, University of Oxford
Using non-linear relationships Danger-zone profiles Ideal profiles and profile matching Qualification grids
The study • Managers attending 5-day leadership development programme • N=279; 58% male, 81% white, 45% degree level • Tools: 16PF, Benchmarks What do nonlinear relationships add?
Nonlinear models • Linear • Quadratic • Cubic • Power • S • Logistic • Exponential
Variables • Leadership • Derailment • Promotability • Performance (Self and boss ratings) Each relationship was tested with linear and nonlinear regression
Findings: linear relationships best • Emotional stability with self-ratings of leadership, derailment and promotability • Dominance with self-ratings of leadership, derailment, promotability and performance • Rule consciousness with boss rating of leadership and self rating of derailment
Mixed linear and nonlinear (1) Liveliness: • Linear with self-ratings of leadership and performance • Quadratic with self-rating of promotability
Liveliness and self rating of promotability Linear .046 Quadratic .072 Cubic .072 Power .062 S .066 Exponential .049 Logistic .069
Regression - summary • C, E, G show linear relationships; other scales more mixed • Of 35 significant results, 20 explained better by nonlinear relationships • Of the nonlinear relationships, half are best explained by cubic regression and only 4 by quadratic
Boss performance rating How to convert these to danger-zones or qualification grids?
Danger zones and qualification grids Produce danger zones and qualification grids for the other 3 factors Refer to handout, pages 2-3
Conclusions • Some support for nonlinear relationships • In predictive work, consider hypotheses • Nonlinearity offers only modest returns over linearity • In nonlinear relationships, the middle isn’t always best • With danger-zones and qualification grids, even nonlinear relationships may give a linear result
References Benson, M.J. & Campbell, J.P. (2007). To be, or not to be, linear: An expanded representation of personality and its relationship to leadership performance. International Journal of Selection and Assessment, 15, 232-249. CCL (2001). Benchmarks Manual. Center for Creative Leadership. Huy, Le, Oh, I., Robbins, S.B., Illies, R., Holland, E. & Westrick, P. (2011). Too much of a good thing: Curvilinear relationships between personality traits and job performance. Journal of Applied Psychology, 96, 113-133. Kulas, J. T. (2013). Personality-Based Profile Matching in Personnel Selection: Estimates of Method Prevalence and Criterion-Related Validity. Applied Psychology, 62, 519–542. Russell, M. & Karol, D. (2002). 16PF Fifth Edition Administrator’s Manual. Champaign, IL: IPAT Inc. Seber, G. A. F., & Wild, C. J. (2003). Nonlinear regression. New York: John Wiley & Sons. Whetzel, D.L., McDaniel, M.A., Yost, A.P. & Kim, N. (2010). Linearity of Personality-Performance Relationships: A large-scale examination. International Journal of Selection and Assessment, 18, 310-320).
Thank you. Any questions? Download from www.opp.com/bps_dop_2014