Download
1 / 42
430 likes | 591 Vues
The Live Reef Food Fish Trade (LRFFT). A supply chain review and breakout discussion for the APEC-WWF workshop Bali, Indonesia. March 1-3, 2011. Objective. Why do we care?

E N D
The Live Reef Food Fish Trade (LRFFT) A supply chain review and breakout discussion for the APEC-WWF workshop Bali, Indonesia March 1-3, 2011
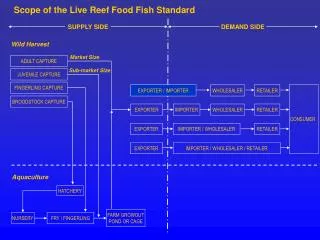
Objective • Why do we care? • Industry structure is critical in informing any efforts to influence the future trajectory of the industry (e.g. certification, fishery reform projects, investment standards, major buyer engagement, voluntary standards, trade networks, trade restrictions, etc.). • Objectives for this session: • Test the current synthesis of the LRFFT supply chain • Update estimates of total industry value and volume • Fill in the major gaps around end markets and industry concentration • Structure • Overview of trade as we know it (20 min) • Rough description of current supply chain and value chains (10 min) • Breakout groups to discuss the findings and suggest revisions, additions, changes, etc. (60 min): If appropriate, may break into groups with regional foci: Indonesia, Philippines, Malaysia, and end markets (Hong Kong, China).
Size of the trade: Previous reviews suggested that the global LRFF market was worth approximately $800M to $1B at the point of sale; with 30,000 tons of LRFF traded globally per year from 1999-2002 Value/Volume Reference Assumptions and Methodology Global trade estimated at 30,000 tons, worth $810M-$1B annually, assuming Hong Kong is 60% of the market Sonny Koeshendrajana (2006), citing Sadovy (2003) Volume estimate from 2002; provided by CSD and AFCD data – CSD represents mainly imports by air, and AFCD does not identify source country for import data Price used to determine market value was approximately $27 per kg (roughly the average retail price of select species in March 2003) Only includes officially reported import data Official Hong Kong imports of 13,000 tons in 2002; worth an estimated $350M at final point of sale Geoffrey Muldoon, Peter Scott, APEC (2005), citing Sadovy (2003) Uses the above assumptions and methodology but includes an estimate of unreported imports; Assumes that Hong Kong-flagged fishing vessels only declare half of their imports of LRFF Total HK imports may have been 18,000 tons annually, if we estimate unreported imports, worth $450-500M under the same assumptions Pomeroy, et. al. (2005) citing McGilvray and Chan (2001) Padilla et. al. (2003) citing $1 billion from Pratt et. al. (2000) Sadovy (2003) extrapolating $810 million Uses the above assumptions to estimate world market value of live reef food fish. Assumes that Hong Kong, China is 60% of the market, including re-exports
Updating the figures for volume and retail value using the same assumptions suggests that the LRFF market is worth closer to US $2B in current dollars • Includes imports via air – 64% • Includes imports via fishing vessel – 36% • AFCD historically assumed that documented imports via shipping vessels are underreported by about 50% • We assume that the total of 3,200 tons of imports via fishing vessels, includes an estimate of unreported landings via fishing vessels (WWF analysis of CSD and AFCD data) • Hong Kong imported 10,630 tons of live reef food fish in the year 2009 (WWF analysis of CSD and AFCD data, 2009) • This factors in unreported landings via HK-flagged fishing vessels (WWF analysis of CSD and AFCD data, 2009) • The estimate that Hong represents 60% of the live reef food fish market remains unchanged (Sadovy et. al. 2003) • Current retail prices in Hong Kong are estimated at roughly $96 per kg (FMO wholesale price data, and IMA mark-up estimate) • According to the Fish Marketing Organization, the Hong Kong wholesale price for LRFF averaged $55 per kg in 2009 • IMA estimated that the markup between wholesale and retail prices in Hong Kong was 74% between 1999 and 2003. • Validation: WWF reports that current Hong Kong retail prices range between HK$400 and HK$1,200 depending on species ((10,630) / 0.60) tons x $96 x 1,000 kg per ton = ~ $2 billion 17,716 tons total
The LRFFT is most heavily concentrated in the coral triangle with end markets including Hong Kong and mainland China, but we don’t have numbers to estimate the size of each flow Source: WWF
UN COMTRADE also collect data on live fish trade. However, it is not specific enough to gauge trends in the LRFFT. Exports of live fish over time (USD) Too inclusive:Includes trade of ornamental live fish, and non-reef live fish such as eel Not necessarily accurate: Does not include officially unreported trade Imports of live fish over time (USD)
According to Hong Kong’s CSD, imports of live reef food fish by air were highest from Philippines, Indonesia and Thailand % air imports by volume and country of origin in year 2009 Total = 6,854 tons Source: Hong Kong Census & Statistics Department Other category includes: Vietnam, Kiribati, India, Cambodia, Canada, Brunei, Turkey, Togo, New Zealand, Papua New Guinea, Sri Lanka, Myanmar, France, Singapore
In 2009, reported landings by fishing vessels indicated that Indonesia and Malaysia were the largest suppliers to Hong Kong by sea Share of volume of Hong Kong’s imports by source country in 2009 (%) Total = 1,893 tons Data from Agriculture, Fisheries and Conservation Department for the year 2009 This data represents estimates from information provided voluntarily by nine traders shipping live marine fish into Hong Kong These traders’ imports only represent about 15% of Hong Kong’s total live marine fish imports *Tiger grouper, leopard coraltrout, green grouper, flowery grouper, brown-spotted grouper, roving spotted grouper, barred cheek coral trout, speckled blue grouper, spotted coraltrout, giant grouper, mangrove snapper, high finned grouper, other wrasses and parrotfishes
If we double landings by fishing vessels and include air shipments landings, two-thirds of the overall Hong Kong imports come from Indonesia, the Philippines, and Malaysia. Share of volume of Hong Kong’s total imports by source country in 2009 (%) Total = 10.500 tons Data from Agriculture, Fisheries and Conservation Department and CSD for the year 2009
The Philippines has traditionally been the largest exporter of live reef food fish in the world. In 2006, the Philippines officially exported approximately 7,000 tons of live grouper. Exports of live grouper from Philippines over time (tons) In 2006, the Philippines exported approximately 7,000 tons of live grouper. We do not know what fraction of that fish ended up in the Hong Kong market. Current official HK imports of fish from the Philippines are closer to 2,000 mt. We have no estimates for unreported exports from the Philippines, e.g. those through Malaysia. Tons Year Philippines exports vs. Hong Kong imports in 2006 (tons) Tons Source: Bureau of Agricultural Statistics, Philippines; Sadovy, et. al. 2003; The Agriculture, Fisheries and Conservation Department of the Hong Kong SAR Government;
Malaysia officially exports 2,000 tons of LRFF. Unreported trade may be substantially larger. Share of Malaysia’s exports that are legal vs. illegal The amount of live reef food fish being legally exported by Malaysia is around 2,000 metric tons annually, of which 85% comes from Sabah. Malaysia exports may include a substantial quantity of unreported live reef food fish via boat, estimated by one industry expert at 8,000 tons per year. Tons Share of Malaysia’s exports coming from Sabah Tons Source: Sadovy, et. al. 2003; The Agriculture, Fisheries and Conservation Department of the Hong Kong SAR Government; Expert opinion on Malaysian trade of LRFF
Indonesia was one of the largest exporters of live reef food fish, but official exports peaked in 1995 Exports of live reef food fish from Indonesia over time (tons) Tons In 2005, Indonesia officially exported approximately 1,280 tons of live reef food fish.Today, Hong Kong alone now officially records about 3,000 metric tons. We have no estimates for unreported exports from Indonesia or direct exports to non-Hong Kong destinations.. Year Indonesia’s exports vs. Hong Kong’s imports in 2005 (tons) Tons Sources: WWF Trade Scoping Study, 2007.; Indonesian Directorate General of Fisheries
Thailand produced about 3,105 tons of grouper through aquaculture in 2008, and is a significant exporter mostly of green grouper and tiger grouper Production of grouper through aquaculture over time (tons) Hong Kong imports of tiger grouper over time by air and by fishing vessel* (‘000 kg) Tons Hong Kong imports of green grouper over time by air and by fishing vessel* (‘000 kg) Year Source: WWF Coral Triangle Program, Workshop Report, 2009. Source: FAO Global Aquaculture Production Online Query Results
Taiwan farms nearly 17,000 tons of farmed grouper each year, a quarter of which is exported Production of grouper through aquaculture over time (tons) Taiwan’s share of global grouper aquaculture in 2007 Total = $205 million Tons NA Year Average production and export of live grouper in Taiwan We estimate that Taiwan consumes about three quarters of its farmed grouper production domestically Tons Sources: Rimmer et. al., “Aquaculture of groupers in Asia and the Pacific”, 2005.; Fisheries Agency, Taiwan; Chang, Meg, “Groupers help boost nation’s aquaculture” Taiwan Today, 2009.
But what are the actual numbers? Questions for the breakout session, Markets Group • Based on your professional judgment, what share of the global LRFFT passes through the Hong Kong market, including fish that is re-exported (e.g. 60%? More? Less? What is a reasonable range)? ___________% • What fraction of Hong Kong’s imports do we think are re-exported (0-25% 25-50%? 50-75%? 75-100%)? ___________% • If you had to estimate, what are the largest end markets for LRFF? What fraction of the global LRFFT ends up in these different end markets? • Hong Kong ______________% • China ______________% • Taiwan ______________% • Singapore ______________% • Japan ______________% • Others? ______________% • To what extent do you trust the data reported to the Hong Kong authorities? In particular, do we feel confident in the estimates of landings by fishing vessels (just 3,000 tons per year?) • Is $100/kg a reasonable estimate for a retail price for LRF? Too low? Too high? What would a better estimate be? ___________ • Do any producing countries have a substantial domestic consumption of LRFF? Malaysia? Indonesia?
But what are the actual numbers? Questions for the breakout session, Markets Group • How would describe the structure of the supply chain within Hong Kong? How many importers, wholesalers, distributors, or retailers are there? • Does the Hong Kong Chamber play a role in organizing this community? • Is there much vertical integration in the industry? Are there patronage systems still in play? • Who has the power in the supply chain? Who makes the most profit (but volume or value)?
Philippines Breakout Group: a draft supply diagram? ~44 PhP = $1 Retailers Wholesalers Hong Kong Importers Other end markets Commercial planes 2,800 tons/yr? 4,200 tons/yr? Manila-based Exporters No longer in operation Charter planes Buying stations Yuki Aquamarine Kos Aquamarine Great Ocean (Manila-based) Kenneth Aquamarine (Manila-based) Sea Dragon (Manila-based) Cage Operators Add PhP100 per fish Financiers Add PhP20 per fish Middlemen IUU fish to Malaysia and carrier vessels (5,000 tons?) Sometimes fish sold exclusively in exchange for gear/loans ~3,000 Fishers; 55% of production in Palawan Source: Padilla et. al. 2003 Pg. 26-27; LRFF workshop 1 Pg. 46 (IMA numbers); Pomeroy Pg. 86; 2005 workshop_2_Pg. 146
Philippines Breakout Group: how you make this more accurate? Price? Retailers Price? Wholesalers Price? Hong Kong Importers Destinations??? Commercial planes (main companies? Price? Volume? Volume? Manila-based Exporters (Number?) No longer in operation Price? Charter planes Yuki Aquamarine Kos Aquamarine Great Ocean (Manila-based) Kenneth Aquamarine (Manila-based) Sea Dragon (Manila-based) Cage Operators Price? Volumes? AMO/Financiers (Number?) Price? Volume? Middlemen (Number?) IUU fish to Malaysia and carrier vessels (quantity? Price?) Volume? Price? Volume? Fishers (Number?) (Share of production in Palawan?)
Questions for thePhilippines Breakout Group • Can we estimate price or volume of LRFF at any step of the chain? • How many people/businesses operate at each step of the chain? Is there much consolidations? • How much production is moved to Malaysia? How do we know? • What fraction of exports from the Philippines do we think do not go to Hong Kong? E.g. what share or amount do we think is shipped directly to • China ______________% • Taiwan ______________% • Singapore ______________% • Japan ______________% • Others? ______________% • To what extent do you trust the data reported to the official Philippines export data? • Is there any domestic consumption of LRFF within the Philippines? • Is there much vertical integration in the industry? Are there patronage systems still in play? • Who has the power in the supply chain? • Who makes the most profit?
Malaysia Breakout Group: a draft supply diagram $45/kg in 2003 (IMA) Retailers ~160 ringgits/kg or $53/kg $25/kg in 2003 (IMA) Wholesalers ~120 ringgits/kg or $40/kg HK flagged vessels Hong Kong Shanghai Singapore, Taiwan (buying broodstock) Via commercial air freight (Cathay Pacific, Malaysia Airlines, South China Air) Just 1-2 shipments/yr ~80-85% ~15-20% Kota Kinabalu exporters (~10 major exporters, but 1000s of permits) ~90 ringgits/kg or $30/kg ~2,000 tons per year Lorries in Kudat transfer to Kota Kinabalu (“thousands of operators”) IUU on carrier vessels: ~3-4X volume of legal exports ~70 ringgits/kg or $23/kg Live fish carriers transfer to Kudat Holding cage operators along shoreline (~300 operators of various scale) ~60 ringgits/kg or $20/kg 1,000+ fishers in Sabah and Palawan (~60% of Sabah fish caught in Philippines)
Malaysia Breakout Group: How would you make this more accurate? Price? Retailers Price? Wholesalers Price? HK flagged vessels Hong Kong Shanghai Singapore, Taiwan (buying broodstock) Via commercial air freight (Cathay Pacific, Malaysia Airlines, South China Air) Volume? Volume? Volume? Kota Kinabalu exporters (NUMBER?) Price? Volume? Lorries in Kudat transfer to Kota Kinabalu (NUMBER?) IUU on carrier vessels: ~3-4X volume of legal exports Price? Volume? Live fish carriers transfer to Kudat (NUMBER?) Price? Volume? Holding cage operators along shoreline (NUMBER?) Price? Fishermen in Sabah and Palawan (NUMBER?) (% of Sabah fish caught in Philippines)
Questions for theMalaysia Breakout Group • Are the estimates of volume, value, and number of people at each step of the supply chain accurate? • In particular, what do we think of the unreported export estimates? • What fraction of exports from Malaysia do not go to Hong Kong? E.g. what share or amount do we think is shipped directly to • China ______________% • Taiwan ______________% • Singapore ______________% • Japan ______________% • Others? ______________% • To what extent do you trust the data reported to the official Malaysia export data? • Is there any domestic consumption of LRFF within Malaysia? Any way to estimate it? • Is there much vertical integration in the industry? Are there patronage systems still in play? • Who has the power in the supply chain? • Who makes the most profit?
Indonesia Breakout Group: Starting from scratch…how to fill this in? Price? Retailers Price? Wholesalers (HK, elsewhere) Hong Kong Importers Other end markets Xx tons/yr? xx tons/yr? Commercial planes Exporters (Number?) Charter planes Buying stations Price? Financiers (Number?) Price? Carrier vessel transport to Hong Kong (Price? Volume? # of vessels?) Middlemen (Number?) Price? ~xxx Fishers (xx% of production in Eastern Indonesia) Source:
Questions for theIndonesia Breakout Group • Can we estimate price or volume of LRFF at any step of the chain? • How many people/businesses operate at each step of the chain? Is there much consolidations? • We’ve been told that production is moving toward Eastern Indonesia. Is this true? Any sense of the relative share of production coming from different parts of Indonesia? • What fraction of exports from Indonesia do we think does not go to Hong Kong? E.g. what share or amount do we think is shipped directly to • China ______________% • Taiwan ______________% • Singapore ______________% • Japan ______________% • Others? ______________% • To what extent do you trust the data reported to the official Indonesia export data? • Is there any domestic consumption of LRFF within Indonesia? • Is there much vertical integration in the industry? Are there patronage systems still in play? • Who has the power in the supply chain? • Who makes the most profit?
Generalized value chain of live reef food fish trade Consumer X-Y% = estimated proportion of total value-added retained by intermediary (X-Y%) = percentage of total trade volume Retailer 30-35% Distributor Wholesaler 10-15% Importer 5-10% Stopover Exporter 10-30% Stopover 1st/2nd buyer 1st buyer 15-25% (15-40%) (0-35%) (50-70%) Aquaculture (10-15%) Marine fishers (85-90%) 5-15% Source: Sadovy et. al. 2003 Pgs. 3-4; LRFF workshop 2 Pg. 97 – Muldoon, Johnston – hypothetical boxed values
Generalized value chain? • Do these estimates seem right/wrong for the trade as you know it? • Who makes the most profit in this supply chain? The exporter? The retailer? Who makes the least profit? • _________________________________________ • Who has the most power in this supply chain? • _________________________________________ • Who in this supply chain has the most responsibility to ensure that the LRFFT is sustainable? • _________________________________________ • What steps could each link in the supply chain take to ensure a more sustainable LRFFT? • _________________________________________ Consumer Retailer 30-35% X-Y% = estimated proportion of total value-added retained by intermediary Wholesaler 10-15% Importer 5-10% Exporter 10-30% 1st/2nd buyer 15-25% Marine fishers 5-15%
“Mainland China, Thailand, Indonesia, Malaysia, the Philippines, Australia and Vietnam have historically been the major exporters of wild-caught reef fish as well as wild-caught fry and fingerlings for grow-out, accounting for approximately 95% of all recorded imports into Hong Kong.” Source: Sadovy 2003 pg. 6; Trade scoping study 2007 pg. 9
Although the live food fish sector is a small portion of fish trade, the high premium for live fish makes this market highly lucrative relative to the fresh fish market Average retail prices (March 2003) of dead and live reef food fish in Hong Kong, China (USD/kg) Source: Sadovy, 2003
The live reef food fish trade has expanded to include many source countries; global aquaculture production of groupers is now in excess of the LRFFT, though most destined for the fresh fish market = Wild capture = Aquaculture from wild seed Supply of live reef food fish as of 2005 Global aquaculture production in 2007 = Full cycle mariculture Primary source countries: • Indonesia, • Philippines • Australia • PRC • Malaysia • Thailand • Viet Nam Contributing source countries: • Fiji Islands • Maldives • Marshall Islands • Papua New Guinea (PNG), Seychelles • Singapore • Solomon Islands tons Pomeroy et. al. “Evaluation of Policy Options for the Live Reef Food Fish Trade: Focus on Calamianes Islands and Palawan Province, Philippines, with Implications for National Policy”, Pg. 13, 2005.
Recorded import volumes into Hong Kong have been relatively constant or increasing, though down from the 1990s. Volume of Hong Kong LRFF imports over time Value of Hong Kong LRFF air imports over time Data from Agriculture, Fisheries and Conservation Department – Hong Kong, as of Feb. 20, 2011 This data represents live reef food fish . No fish fry or ornamental fish are included The volume data includes imports by air and by fishing vessels. Value data reflects import price (Vehicle Price + Shipping freight + Insurance Cost), not wholesale price, of air imports only Tons Thousands of US$ Year Year Sources: The Agriculture, Fisheries and Conservation Department of the Hong Kong SAR Government; Hong Kong Census & Statistics; WWF
WWF used CSD and AFCD data to estimate the difference between imports by air and imports by fishing vessel Hong Kong import volume by air transport over time (tons) Hong Kong import volume by air transport and fishing vessel over time (tons) % imports by air and by fishing vessel in 2009 Total = 10,630 tons Source: WWF Coral Triangle Program, Hong Kong Workshop Report, 2009.
At least 59 species are traded in the live reef food fish market Hong Kong annual imports of select species in terms of value (US$) Hong Kong Census and Statistics Department reported 6,830 tons of live fish trade in 2009. This is mostly LRFF imports via air. The majority of Hong Kong’s imports are leopard coraltrout. Hundreds of thousands of US$ Year Hong Kong annual imports of select species in terms of volume (tons) Tons Year Sources: Pomeroy, et. al. 2005, Pg. 14; Hong Kong Census and Statistics Department
Composition of Hong Kong imports – leopard coral trout or leopard coral grouper is the most popular live reef food fish species consumed % breakdown of total Hong Kong import volume by species as of 1999 % breakdown of sample of Hong Kong import volume by species as of 2009 Total = 24,000 tons Sample total = 6,830 tons Source: http://wwwx.spc.int/coastfish/News/lrf/7/LRF7-07.htm - Appendix, Interviews with 39 out of 114 companies that trade live fish in Hong Kong; Hong Kong Census and Statistics Department
Leopard coraltrout has been the most significant species by value for air imports of LRFF into Hong Kong Thousands of US$ Year Sources: The Agriculture, Fisheries and Conservation Department of the Hong Kong SAR Government; Hong Kong Census & Statistics; WWF
Taiwan consumes a large volume of live reef fish, but most of it comes from domestic aquaculture Imports of live grouper and other live fish in 2009 Tons Average production and export of live grouper in Taiwan We estimate that Taiwan consumes about three quarters of its farmed grouper production domestically Tons Sources: Fisheries Agency, Taiwan; Chang, Meg, “Groupers help boost nation’s aquaculture” Taiwan Today, 2009.
Re-exports: Mainland China – Guangzhou Seafood Market An estimate of Guangzhou Seafood Market’s turnover and composition as of 2006 Tons In 2006, Hong Kong imported 15,700 tons of LRFF. Roughly half of that appears to have been re-exported to mainland PRC Source - Johnson, B. (ed.) 2007. Economics and market analysis of the live reef-fish trade in the Asia–Pacific region. ACIAR Working Paper No. 63, 173 Pg. 83
Pricing: Value and Size of the reported LRFF trade in Hong Kong, according to the Fish Marketing Organization Source: Fish Marketing Organization – Hong Kong
Pricing: The average Hong Kong wholesale price of LRF from 1999-2003 was HK$196/kg (~$25/kg); the average retail price was 74% higher at HK$336/kg (~$45/kg). Source: Johnson, B. (ed.) 2007. Economics and market analysis of the live reef-fish trade in the Asia–Pacific region. ACIAR Working Paper No. 63, 173 pp. – using data from International Marine Alliance surveys of 726 restaurants in 18 districts of Hong Kong
Hong Kong Chamber: Members of the Hong Kong Chamber of Seafood Merchants are a significant portion of the LRFF trade % of importers and wholesalers in the Chamber % of distributors in the Chamber Source: Interview with Irwin Wong, WWF