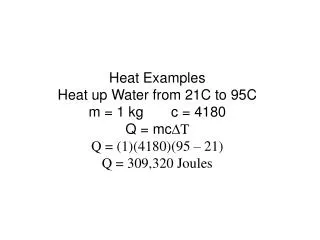
Download
1 / 68
900 likes | 2.22k Vues
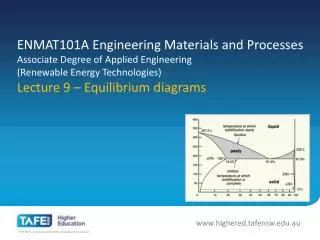
Thermal Equilibrium Diagrams. Thermal Equilibrium Diagrams. Thermal Equilibrium Diagrams show the temperatures at which phase changes take place in alloys of different percentage composition . Phase .

E N D
Thermal Equilibrium Diagrams Thermal Equilibrium Diagrams show the temperatures at which phase changes take place in alloys of different percentage composition.
Phase A Phase is a portion of a system that has uniform physical and chemical characteristics.
Thermal Equilibrium Diagrams are made for information gained form Cooling Curves.
Cooling Curve When the temperature of a cooling molten metal alloy is plotted against time, a cooling curve is formed.
The Cooling Curve of 100% Copper Remember this only happens for pure metals. When cooling a solid pure metal, change from a solid to a liquid at constant temperature. This is called the Melting Point Temperature. The heat that is released in the transition from a solid to a liquid is called hidden or Latent Heat. LIQUID Solidification Starts Solidification Ends SOLID
Latent Heat Latent heat is the quantity of heat energy absorbed or released when a substance changes its physical phase at constant temperature. The energy that goes in breaks the bond of the atoms.
The Cooling Curve of Pure Metal Pure Metal change directly from Liquid to Solid at 1 temperature. LIQUID SOLID
1500 Temperature 0C Undercooling 1100 1000 Time Undercooling If a metal is 100% pure and contains no traces of other elements then some under cooling may occur before solidification begins. Under cooling is when the temperature drops below the liquid to solid temperature for a short period. Fall in temperature stops temporarily at the freezing point because of Latent heat
The Cooling Curve of an Alloy Alloys change from Liquid to Solid through a pasty state over a temperature range. LIQUID Solidification Starts “PASTY” STATE Solidification Ends SOLID
Pure Metal Alloy Over a Temperature Range 1Temperature
Solid Solution: A Solid Solution is when two metals are completely soluble in each other in both the liquid and solid states. When viewed under a microscope, a solid solution appears like a pure metal. Iron Carbon 100% Lead
TASK The given table shows the solidification temperatures for various alloys of Copper and Nickel. The melting point of Copper is 1083°C and Nickel is 1453°C. Using the graph paper supplied: (i) Draw the equilibrium diagram according to the given data. (ii) Label the diagram and describe the main features. (iii) For the alloy with 50% Nickel determine, from the diagram, the ratio of the phases at 1250°C.
Axis of Diagram 1600 TEMPERATURE (°C) 1400 1200 1000 800 600 400 200 NICKEL COPPER 0% 100% 20% 80% 40% 60% 60% 40% 80% 20% 100% 0% PRECENTAGE COMPOSITION
Copper/Nickel Equilibrium Diagram TEMPERATURE (°C) NICKEL COPPER PRECENTAGE COMPOSITION
How Equilibrium Diagrams Are Made Equilibrium diagrams are made from taking information for cooling of different percentage of an alloy and putting it on one graph.
The Cooling Curve of Copper/ Nickel and alloys This is know as a TERMAL ANALYSIS
How A Thermal Equilibrium Diagram Is Made 100% Copper
How A Thermal Equilibrium Diagram Is Made 100% NICKLE
How A Thermal Equilibrium Diagram Is Made 60% Copper 40% Nickel
How A Thermal Equilibrium Diagram Is Made 40% Copper 60% Nickel
Copper/Nickel Equilibrium Diagram • Liquidus Line 1600 Liquid Phase TEMPERATURE (°C) 1400 Liquid Phase and Solid Phase 1200 Solidus Line 1000 800 Solid Phase Phases are defined as regions that differ from one another on an equilibrium diagram. 600 400 Phases defined by composition (not by state – solid, liquid, gas) 200 NICKEL COPPER 0% 100% 20% 80% 40% 60% 60% 40% 80% 20% 100% 0% PRECENTAGE COMPOSITION
Main Features of Equilibrium Diagram • Liquid: the two metals are soluble in each other in the liquid state. • Liquidus Line: the change from fully liquid to pasty state. Above the liquidus line, the alloy is liquid. This is the beginning of solidification. • LiquidandSolid: the alloy is in a pasty form, there are two phases one Liquid and one Solid. • Solidus Line: the change from pasty to solid. Below the solidus line, the alloy is cooling and solid. This is the end of solidification. • Solid: alloy is in solid form.
Introduction To Equilibrium Diagrams • Equilibrium may be defined as a state of balance or stability. • Diagrams indicates the phases the alloy is at different temperatures. • Phases are defined as regions that differ from one another on an equilibrium diagram. Phases defined by composition.
The Meaning of the Term Equilibrium Equilibrium refers to Balance existing in a system • In Metallurgy, Equilibrium means, that the cooling of a metal or an alloy is so slow that all the changes that might take place get the chance to do so. To achieve equilibrium to take place enough time for complete diffusion is required. Metallurgy is the study of metals and their properties
Diffusion Diffusion is the processes by which a substance spread out through another substance. Atoms move in a solid metal in this manner. HIGH CONSTANTRATION LOW CONSTANTRATION
Diffusion in a Solid Atom move form high concentration to low concentration
Water And Sugar PHOTOS How Many Phases Are There? A SINGLE PHASE TWO-PHASES
Phase A Phase is a portion of a system that has uniform physical and chemical characteristics.
Phases Phases are defined as regions that differ from one another on an equilibrium diagram. Phases defined by composition. NOT BY STATE (solid, liquid , gas)
Substitution Solid Solution Alloys Nickel Copper
Copper/Nickel Equilibrium Diagram Copper Copper Nickel Nickel
Ratio of Phases iii)For the alloy with 50% Nickel determine, from the diagram, the ratio of the phases at 1250°C. Tie Line 1250°C TEMPERATURE (°C) 26% 66% NICKEL COPPER PRECENTAGE COMPOSITION
Ratio of Phases A B C 26% 66% Ratio of phases at 1250℃ for 50% Nickel The ratio of Solid to Liquid is:
Ratio of Phases 1250°C TEMPERATURE (°C) NICKEL 26% 66% COPPER 35% PRECENTAGE COMPOSITION Ratio of phases at 1250°C for 35% Nickel
Ratio of Phases 1250°C TEMPERATURE (°C) NICKEL 26% 66% COPPER PRECENTAGE COMPOSITION Ratio of phases at 1250ºC for 60% Nickel
Eutectic Alloys In a eutectic alloy the two metals are completely soluble in the liquid phase but are insoluble in the solid phase.
TASK The given table shows the solidification temperatures for various alloys of Cadmium and Nickel. Using the graph paper supplied: Draw the equilibrium diagram according to the given data. Label the diagram and describe the main features.
Axis of Diagram 1600 TEMPERATURE (°C) 1400 1200 1000 800 600 400 200 BISMUTH CABMIUM 0% 100% 20% 80% 40% 60% 60% 40% 80% 20% 100% 0% PRECENTAGE COMPOSITION
TEMPERATURE (°C) PRECENTAGE COMPOSITION
Cadmium / Bismuth Equilibrium Diagram TEMPERATURE (°C) BISMUTH CADMIUM PRECENTAGE COMPOSITION
Cadmium / Bismuth Equilibrium Diagram 400 • Liquidus Line 350 TEMPERATURE (°C) Liquid Phase 300 • Eutectic • Point 250 200 Liquid Phase and Solid Phase Liquid Phase and Solid Phase 150 100 SolidusLine Solid Phases 50 BISMUTH CADMIMUM 40% 60% 0% 100% 20% 80% 100% 0% 80% 20% 60% 40% PRECENTAGE COMPOSITION
Cadmium / Bismuth Equilibrium Diagram TEMPERATURE (°C) 400 350 Liquid Phase • Eutectic • Point 300 250 Liquid andSolid Bismuth Liquid andSolid Cadmium 200 150 Solid Bismuth and Eutectic Solid Cadmium and Eutectic 100 50 BISMUTH CADMIUM 100% 0% 60% 40% 0% 100% 20% 80% 80% 20% 40% 60% • Green Line • Eutectic Alloy PRECENTAGE COMPOSITION Eutectic Solid Cadmium Solid Bismuth
Cadmium / Bismuth ∘ Cadmium Atoms ∙Bismuth Atoms X 1 000 X 10 000 000
Eutectic Point The point where the liquid alloy changes to solid without going through a liquid/solid state is called the eutectic point.