Download
1 / 29
420 likes | 720 Vues
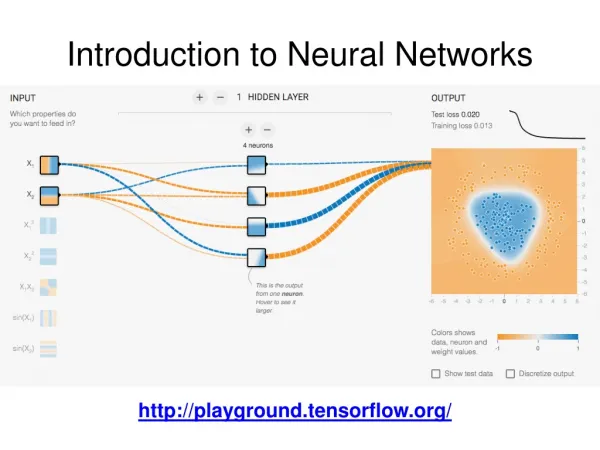
Introduction to Neural Networks in Medical Diagnosis. Włodzisław Duch PhD, DSc Dept. of Informatics, Nicholas Copernicus University, Poland. What is it about?. Data is precious! But also overwhelming ...

E N D
Introduction to Neural Networks in Medical Diagnosis Włodzisław Duch PhD, DSc Dept. of Informatics, Nicholas Copernicus University, Poland
What is it about? • Data is precious! But also overwhelming ... • Statistical methods are important but new techniques may frequently be more accurate and give more insight into the data. • Data analysis requires intelligence. • Inspirations come from many sources, including biology: artificial neural networks, evolutionary computing, immune systems ...
Evolutionaryalgorithms PatternRecognition Multivariatestatistics Expert systems Fuzzylogic Machinelearning Visuali-zation Neuralnetworks Probabilistic methods Computational Intelligence Computational IntelligenceData + KnowledgeArtificial Intelligence
What do these methods do? • Provide non-parametric models of data. • Allow to classify new data to pre-defined categories, supporting diagnosis & prognosis. • Allow to discover new categories. • Allow to understand the data, creating fuzzy or crisp logical rules. • Help to visualize multi-dimensional relationships among data samples. • Help to model real neural networks!
Neural networks • Inspired by neurobiology: simple elements cooperate changing internal parameters. • Large field, dozens of different models, over 500 papers on NN in medicine each year. • Supervised networks: heteroassociative mapping X=>Y, symptoms => diseases,universal approximators. • Unsupervised networks: clusterization, competitive learning, autoassociation. • Reinforcement learning: modeling behavior, playing games, sequential data.
Real and artificial neurons Nodes – artificial neurons Dendrites Signals Synapses Synapses (weights) Axon
Inputs: -1 65 1 5 3 1 Pain Intensity Neural networkfor MI diagnosis ~ p(MI|X) Myocardial Infarction 0.7 Outputweights Inputweights Sex Age Smoking Elevation Pain ECG: ST Duration
MI network function Training: setting the values of weights and thresholds, efficient algorithms exist. Effect: non-linear regression function Such networks are universal approximators: they may learn any mapping X => Y
Knowledge from networks Simplify networks: force most weights to 0, quantize remaining parameters, be constructive! • Regularization: mathematical technique improving predictive abilities of the network. • Result: MLP2LN neural networks that are equivalent to logical rules.
Recurrence of breast cancer Data from: Institute of Oncology, University Medical Center, Ljubljana, Yugoslavia. 286 cases, 201 no recurrence (70.3%), 85 recurrence cases (29.7%) no-recurrence-events, 40-49, premeno, 25-29, 0-2, ?, 2, left, right_low, yes 9 nominal features: age (9 bins), menopause, tumor-size (12 bins), nodes involved (13 bins), node-caps, degree-malignant (1,2,3), breast, breast quad, radiation.
Recurrence of breast cancer Data from: Institute of Oncology, University Medical Center, Ljubljana, Yugoslavia. Many systems used, 65-78% accuracy reported. Single rule: IF (nodes-involved [0,2] Ù degree-malignant = 3 THEN recurrence, ELSE no-recurrence 76.2% accuracy, only trivial knowledge in the data: Highly malignant breast cancer involving many nodes is likely to strike back.
Recurrence - comparison. Method 10xCV accuracy MLP2LN 1 rule 76.2 SSV DTstable rules 75.7 1.0 k-NN, k=10, Canberra 74.1 1.2 MLP+backprop. 73.5 9.4 (Zarndt)CART DT 71.4 5.0 (Zarndt) FSM, Gaussian nodes 71.7 6.8 Naive Bayes 69.3 10.0 (Zarndt) Other decision trees < 70.0
Breast cancer diagnosis. Data from University of Wisconsin Hospital, Madison, collected by dr. W.H. Wolberg. 699 cases, 9 features quantized from 1 to 10: clump thickness, uniformity of cell size, uniformity of cell shape, marginal adhesion, single epithelial cell size, bare nuclei, bland chromatin, normal nucleoli, mitoses Tasks: distinguish benign from malignant cases.
Breast cancer rules. Data from University of Wisconsin Hospital, Madison, collected by dr. W.H. Wolberg. Simplest rule from MLP2LN, large regularization: If uniformity of cell size < 3 Thenbenign Elsemalignant Sensitivity=0.97, Specificity=0.85 More complex NN solutions, from 10CV estimate: Sensitivity =0.98, Specificity=0.94
Breast cancer comparison. Method 10xCV accuracy k-NN, k=3, Manh 97.0 2.1 (GM)FSM, neurofuzzy96.9 1.4 (GM) Fisher LDA 96.8 MLP+backprop. 96.7 (Ster, Dobnikar)LVQ 96.6 (Ster, Dobnikar) IncNet (neural) 96.42.1 (GM)Naive Bayes 96.4 SSV DT, 3 crisp rules 96.0 2.9 (GM)LDA (linear discriminant) 96.0 Various decision trees 93.5-95.6
Melanoma skin cancer • Collected in the Outpatient Center of Dermatology in Rzeszów, Poland. • Four types of Melanoma: benign, blue, suspicious, or malignant. • 250 cases, with almost equal class distribution. • Each record in the database has 13 attributes: asymmetry, border, color (6), diversity (5). • TDS (Total Dermatoscopy Score) - single index • Goal: hardware scanner for preliminary diagnosis.
Melanoma results Method Rules Training % Test% MLP2LN, crisp rules 4 98.0 all 100 SSV Tree, crisp rules 4 97.5±0.3 100FSM, rectangular f. 7 95.5±1.0 100 knn+ prototype selection 13 97.5±0.0 100 FSM, Gaussian f. 15 93.7±1.0 95±3.6 knn k=1, Manh, 2 features -- 97.4±0.3 100 LERS, rough rules 21 -- 96.2
Antibiotic activity of pyrimidine compounds. Pyrimidines: which compound has stronger antibiotic activity? Common template, substitutions added at 3 positions, R3, R4 and R5. 27 features taken into account: polarity, size, hydrogen-bond donor or acceptor, pi-donor or acceptor, polarizability, sigma effect. Pairs of chemicals, 54 features, are compared, which one has higher activity? 2788 cases, 5-fold crossvalidation tests.
Antibiotic activity - results. Pyrimidines: which compound has stronger antibiotic activity? Mean Spearman's rank correlation coefficient used: -1< rs < +1 Method Rank correlation FSM, 41 Gaussian rules 0.77±0.03Golem (ILP) 0.68Linear regression 0.65CART (decision tree) 0.50
Thyroid screening. Clinical findings Finaldiagnoses Hidden units Age sex … … Normal Hypothyroid TSH Hyperthyroid T4U T3 TT4 TBG Garavan Institute, Sydney, Australia 15 binary, 6 continuous Training: 93+191+3488 Validate: 73+177+3178 • Determine important clinical factors • Calculate prob. of each diagnosis.
Thyroid – some results. Accuracy of diagnoses obtained with different systems. Method Rules/Features Training % Test% MLP2LN optimized 4/6 99.9 99.36 CART/SSV Decision Trees 3/5 99.8 99.33 Best Backprop MLP -/21 100 98.5 Naïve Bayes -/- 97.0 96.1 k-nearest neighbors -/- - 93.8
Psychometry MMPI (Minnesota Multiphasic Personality Inventory) psychometric test. Printed forms are scanned or computerized version of the test is used. • Raw data: 550 questions, ex:I am getting tired quickly: Yes - Don’t know - No • Results are combined into 10 clinical scales and 4 validity scales using fixed coefficients. • Each scale measures tendencies towards hypochondria, schizophrenia, psychopathic deviations, depression, hysteria, paranoia etc.
Psychometry • There is no simple correlation between single values and final diagnosis. • Results are displayed in form of a histogram, called ‘a psychogram’. Interpretation depends on the experience and skill of an expert, takes into account correlations between peaks. Goal: an expert system providing evaluation and interpretation of MMPI tests at an expert level. Problem: agreement between experts only 70% of the time; alternative diagnosis and personality changes over time are important.
Psychometric data 1600 cases for woman, same number for men. 27 classes: norm, psychopathic, schizophrenia, paranoia, neurosis, mania, simulation, alcoholism, drug addiction, criminal tendencies, abnormal behavior due to ... Extraction of logical rules: 14 scales = features. Define linguistic variables and use FSM, MLP2LN, SSV - giving about 2-3 rules/class.
Psychometric data 10-CV for FSM is 82-85%, for C4.5 is 79-84%. Input uncertainty +Gx around 1.5% (best ROC) improves FSM results to 90-92%.
Psychometric Expert Probabilities for different classes. For greater uncertainties more classes are predicted. Fitting the rules to the conditions: typically 3-5 conditions per rule, Gaussian distributions around measured values that fall into the rule interval are shown in green. Verbal interpretation of each case, rule and scale dependent.
Visualization Probability of classes versus input uncertainty. Detailed input probabilities around the measured values vs. change in the single scale; changes over time define ‘patients trajectory’. Interactive multidimensional scaling: zooming on the new case to inspect its similarity to other cases.
Summary Neural networks and other computational intelligence methods are useful additions to the multivariate statistical tools. They support diagnosis, predictions, and data understanding: extracting rules, prototypes. FDA has approved many devices that use ANNs: Oxford’s Instruments Ltd EEG analyzer, Cardionetics (UK) ECG analyzer. PAPNET (NSI), analysis of Pap smears …
Challenges Fully automatic universal data analysis systems: press the button and wait for the truth … • Discovery of theories rather than data models • Integration with image/signal analysis • Integration with reasoning in complex domains • Combining expert systems with neural networks …. We are slowly getting there. More & more computational intelligence tools (including our own) are available.