Class Outline
Dummy Variables. We use dummy variables, which are explanatory variables that only take two values, usually 0 and 1. These simple variables are a very powerful tool for capturing qualitative characteristics of individuals, such as gender, race, geographic region of residence. In general, we use dummy variables to describe any event that has only two possible outcomes. .

Class Outline
E N D
Presentation Transcript
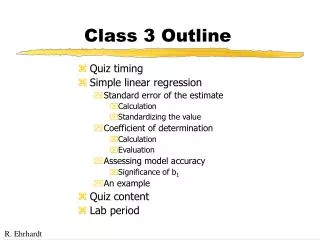
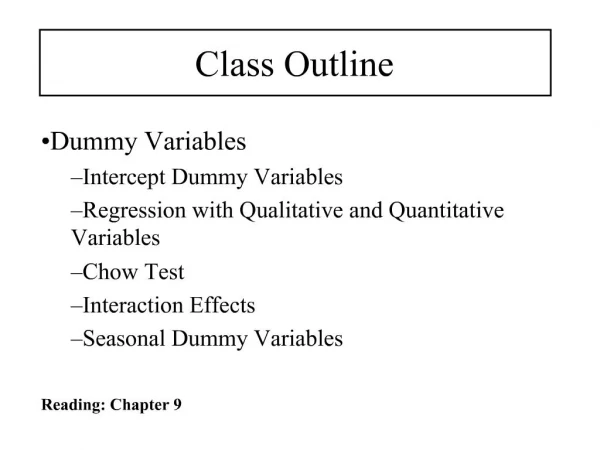
1. Class Outline Dummy Variables
Intercept Dummy Variables
Regression with Qualitative and Quantitative Variables
Chow Test
Interaction Effects
Seasonal Dummy Variables
Reading: Chapter 9
2. Dummy Variables We use dummy variables, which are explanatory variables that only take two values, usually 0 and 1.
These simple variables are a very powerful tool for capturing qualitative characteristics of individuals, such as gender, race, geographic region of residence.
In general, we use dummy variables to describe any event that has only two possible outcomes.
3. Dummy Variables Dummy variables can be used in a variety of cases. A regression model can even contain just dummy variables as explanatory variables
Example
Y= Average salary of public school teacher in state i
Di2= 1 if state is in the Northeast or North Central
0 otherwise
Di3= 1 if state is in the South
0 otherwise
4. Dummy Variables Caution in using Dummy Variables
If a qualitative variable has m categories, introduce only (m-1) dummy variables
The category with no dummy variable is the benchmark
The intercept value represents the measure of the benchmark
Coefficients of dummy variables are known as differential intercept coefficients
The choice of the benchmark is up to the researcher
If we do not introduce an intercept, then we can use as many dummy variables as categories of the qualitative variable
Which specification is the better?
5. Regression with Qualitative and Quantitative Regressors In our previous model we add the expenditure on public schools by local authorities
Y= Average salary of public school teacher in state i
Di2= 1 if state is in the Northeast or North Central
0 otherwise
Di3= 1 if state is in the South
0 otherwise
Xi= spending on public school per pupil
6. Chow Test We would like to test if there is a structural change in the relationship between the regressand Y and the regressors.
Example: Income and Savings in the United States. Can we find a structural change in this relationship after 1982?
7. Chow Test How do we know if there was a structural break in 1982?
Chow Test:
Estimate the regression with the complete sample (Model 3) and obtain the RSSR (Restricted Residual Sum of Squares) with degrees of freedom df=n1+n2-k
Estimate Model 1 and obtain its RSS1 with df=n1-k
Estimate Model 2 and obtain its RSS2 with df=n2-k
We can add RSS2 and RSS1 to obtain the Unrestricted Residual Sum of Squares (RSSUR) with degrees of freedom df=n1+n2-2k
8. Chow Test Chow Test (Continued):
If there is no structural change (Model 1 and 2 are the same) then the RSSR and RSSUR should not be statistically different,
We do not reject the null hypothesis of no structural change is the F value does not exceed the critical F value from the F table.
9. Chow Test Assumptions about the Chow Test
Error variances should be the same
The Chow test only tells us if the models are different, but not what are the causes of those differences
This test assumes that we know the date of the break
10. Chow Test Using Dummy Variables We can analyze the structural breaks using dummy variables. There are different possibilities for the structural break:
Both the intercepts and the slopes coefficients are the same
Only the intercepts are different (same slopes)
The slopes are different (same intercepts)
Both the intercepts and slopes are different
11. Chow Test Using Dummy Variables
12. Chow Test Using Dummy Variables To test if there is a structural break we should run the following regression
Where Y=Savings
X=Income
t=time
D=1 for observations in 1982-1995
0 otherwise
13. Chow Test Using Dummy Variables We can decompose this regression as follows
14. Interaction Effects Using Dummy Variables Consider the Following Model
Where Y=hourly wage in dollars
X=education
D2 =1 if female, 0 otherwise
D3=1 if nonwhite and non-Hispanic, 0 otherwise
15. Interaction Effects Using Dummy Variables In this case, we would like to know if there is an interaction between these two dummy variables, that is if the fact of being a female non-white non-Hispanic has an effect on wages. Then, we run the following model
Observe that
16. Dummy Variables on Seasonal Analysis Many economic variables exhibit seasonal patterns (regular oscillatory movements)
Dummy variables can be use to adjust for this seasonality
Example: refrigerators sales
Where Y= sales of refrigerators, D1, D2, D3 and D4 are dummy variables for the quarters of each year
17. Dummy Variables on Seasonal Analysis
18. Dummy Variables on Seasonal Analysis