Footprint
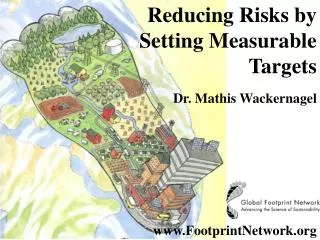
Footprint. Reducing Risks by Setting Measurable Targets. Dr. Mathis Wackernagel. www.FootprintNetwork.org. Metabolism like a cow. 67% Low-Productivity Ocean. Bioproductive Segments. Bioproductive segments. 22%. 4% Biologically Productive Ocean. 11%

Footprint
E N D
Presentation Transcript
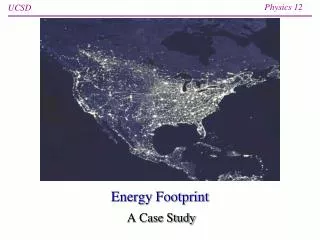
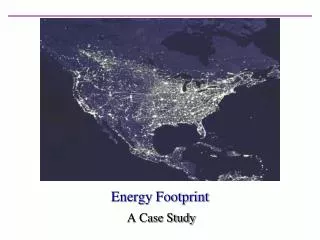
Footprint Reducing Risks by Setting Measurable Targets Dr. Mathis Wackernagel www.FootprintNetwork.org
67% Low-Productivity Ocean Bioproductive Segments Bioproductive segments 22% 4% Biologically Productive Ocean 11% Deserts, Ice Caps and Barren Land 18% Biologically Productive Land
Personal planetoid Global average availability of bioproductive Land + Sea = 1.9 global hectares/person
Footprint components Fossil Fuel Built-up Waste Food Fibres absorption
Global Footprint Global Footprint Accounts (in global hectares/person, 1999 data) Ecological Demand (Ecological Footprint) Ecological Supply (Biocapacity) Footprint Areas for: Biocapacity Areas: Growing Crops 0.53 Crop land 0.53 Grazing Animals 0.12 Grazing land 0.27 Settlements & infrastructure 0.10 Built-up area 0.10 Producing timber & fuelwood 0.33 Forest 0.86 Absorbing excess CO2 1.07 Harvesting Fish 0.14 Fishing Grounds 0.14 Total Global Demand 2.29 Total Global Supply 1.90 Demand Exceeds Supply By 20% >
Footprint time series Footprint time series
What Does this Open up? • Accounting leads to accountability • Targets informed by risks associated with different scenarios • 2 simple choices: integrating climate change and biocapacity • Performance measure
Cat on Roman foot Mathis@FootprintNetwork.org www.FootprintNetwork.org