Download
1 / 16
160 likes | 259 Vues
Explore how USDA’s National Agricultural Statistics Service provides vital data on crops, livestock, expenses, demographics, and more at a local level. Understand the importance of this information for growers, lenders, legislation, and public education. Learn about Census of Agriculture methods, funding challenges, confidentiality laws, and data precision. Contact Marc Tosiano for details.

E N D
Small Area Data for Agriculture APDU Conference Sep 24, 1009 National Agricultural Statistics Service, USDA www.nass.usda.gov • Marc Tosiano, MISO Staff Director • USDA, National Ag Statistics Service
Crops, Livestock, Poultry,Economic, Demographic& Environmental Statistics NASS Mission Statement
Cooperative Agreements in 46 Field Offices Headquarters in Washington, DC Olympia Helena Fargo St. Paul Portland Concord Madison Sioux Falls Boise Des Moines Lansing Albany Cheyenne Harrisburg Lincoln Reynoldsburg Springfield Salt Lake City West Lafayette Reno Lakewood Topeka Charleston Trenton Columbia Sacramento Louisville Dover Richmond Oklahoma City Annapolis Raleigh Nashville Little Rock Phoenix Columbia Las Cruces Jackson Athens Baton Rouge Montgomery Austin Orlando San Juan Honolulu Palmer Western Field Offices Eastern Field Offices
Farm Definition A farm is ”any place where $1,000 or more of agricultural products were produced and sold, or normally would have been sold.” (since 1974)
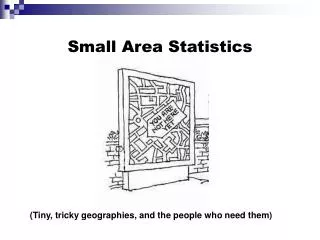
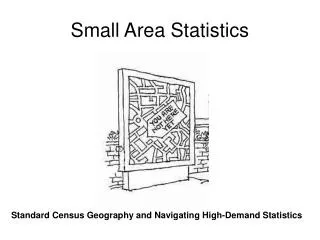
“Small Area” defined • State • County • Zip Code (limited data) • US Congressional Districts • State Legislative Districts • Watershed • Tribal Lands
Ag Census measures US Agriculture • Farm numbers & farmland usage • Crops, livestock & poultry production and sales • Expenses by category • Demographics • Farm equipment & machinery • Farm practices • Government payments • and more
5-year Census of Agriculture How is this data important? (1 of 2) • Growers’ business plans • Lenders • Universities & Ag Extension • Location of • Food sources for buyers • Farm Supply/Equip. Dealers • Food & Fuel Manuf. Facilities
5-year Census of Agriculture How is this data important? (2 of 2) • Educate public about food sources • Farm Bill & other legislation • Government program development • Minority outreach by USDA • & much more
Ag Census Methods Correction due to non-response • 75% minimum response per county • Remaining are imputed
Ag Census Methods Correction due to list incompleteness • Missing farms estimated by state using the complete AREA Frame • Counties are calibrated to add back to State estimate WHY? Funding doesn’t allow enough Area Segments per county.
NASS Area Frame Segment Each segment is about 1 sq mile For Example, 300 segments in Pennsylvania
Limits to Census County Data Calibration Precision Putting data into correct county is only based on mail address & county of major sales Confidentiality Some county data must be hidden due to confidentiality laws
Limited annual county data • Federally Funded • Major field crops, but only in the major states for the crop • Cattle and Dairy Cows in major states • State funding varies for additional • crops, livestock or poultry
County data has direct impact Land Values State land preservation programs Crop Yields Crop Insurance payments (RMA) Disaster payments (FSA) Cash Rents Rent paid to CRP participants (FSA)
Annual County Methods Data taken from all surveys & Fall survey is sent to about 25% of farms • Publication of each county depends on • Minimum of 30 responses for each commodity • OR minimum of 75% coverage of each commodity
Thank you ! Marc Tosiano National Agricultural Statistics Service, USDA Room 5129 South Building 1400 Independence Ave, SW Washington, DC 20250 202.720.7017 800.727.9540, Customer Service nass@nass.usda.gov www.nass.usda.gov