Download
1 / 15
150 likes | 289 Vues
Comparing Representative farms from the Midwest US to Germany. Luke Iseminger. If you don’t know what you’re talking about at least make yourself look good. --Max Schmidt. International Attempt to compare production systems across world

E N D
Comparing Representative farms from the Midwest US to Germany Luke Iseminger
If you don’t know what you’re talking about at least make yourself look good. --Max Schmidt
International Attempt to compare production systems across world In our context, benchmarking means that we are comparing typical farms, production systems and enterprises and their economics horizontally (at one specific point of time) and vertically (over time).
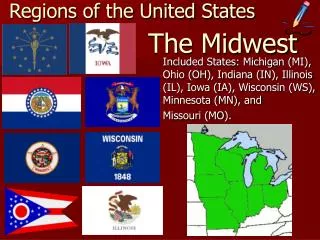
What is a typical farm? This is probably the most frequent question raised to the Networks. A typical farm is • an existing farm or a data set describing a farm, • in a specific region which represents a major share of output for the product considered, • running the prevailing production system for the product considered, • reflecting the prevailing combination of enterprises as well as land and capital resources, • as well as the prevailing type of labor organisation http://www.agribenchmark.org/methods_typical_farms.html
Comparison Measures -Monetary research is done in US$ --.79 € to US$1 -All land comparison is done in ha -All Production done in t/ ha -Oilseed production is compared to rapeseed --SB to Rapeseed is .930:1 -Land costs were not factored into the research
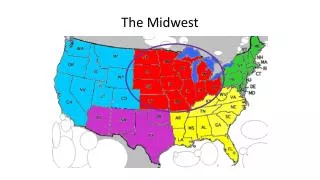
Representative Iowa Farm Information on the typical farm • Iowa, USA • US700IA – USA, 700 ha in Iowa • 1540 acres • All machinery belong to the farm • Crop rotation: Corn – Soybeans • Fertilizer level (nitrogen): 165 kg N/ha • Yield level corn: 11 t/ha (178 bu./ acre) • Market price corn: 99 €/t Tillage system: – Conservation Tillage - Corn
Representative German Farm Information on the typical farm • Sachsen-Anhalt, Germany • DE1300SA – Germany, 1300 ha in the region Sachsen-Anhalt • Specialized cash crop farm • Crop rotation:I: Sugar beet - winter wheat - winter wheat/winter barley - pea - winter wheatII: Winter canola-winter wheat-winter wheat / winter barley • Fertilizer level (nitrogen): 185 kg N/ha • Yield level winter wheat: 8,8 t/ha • Market price winter wheat: 125 €/t • Tillage system: Conservation Tillage – Wheat
Operating Costs • Operating costs are key to all production systems. They are a good indicator of the profitability of the operation. • Western hemisphere producers spend only a fraction of what European producers spend on operation costs. • The Iowa producer had just shy of $200/ ha operating costs • The German operation had just below $550/ ha operating costs
Production Operations • The Iowa producer had anywhere from 4-6 operations to prepare seedbed and apply chemicals • The German producer had anywhere from 20-22 operations to prepare the seedbed and apply chemicals and fertilizer, making these costs 3.15X higher
Subsidies/ Insurance • 250 to 300 €/ha Average subsidies received from German government ($89.77-$107.72/ A) • Hail Insurance is the only type of crop insurance available to German farmers at the present time • Premiums are from roughly 30 to 40€/ ha ($10.77-$14.36/ A)
Subsidies/ Insurance • Direct Payments • For each commodity, the direct payment for each crop year equals 85 percent of the farm's base acreage times the farm's direct payment yield times the direct payment rate. • Counter-cyclical Payments • Counter-cyclical payments provide support counter to the cycle of market prices as part of a "safety net" in the event of low crop prices. Counter-cyclical payments for a commodity are only issued if the effective price for a commodity is below the target price for the commodity.