Quantitative Data Analysis: Statistics
Explore the world of statistics through this overview covering general statistics, hypothesis testing, various data types, visualization methods, and error analysis. Learn the basics and enhance your statistical research skills!


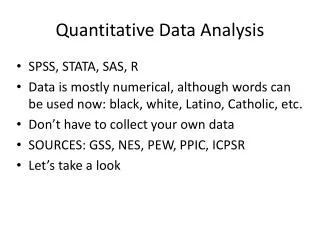
Quantitative Data Analysis: Statistics
E N D
Presentation Transcript
Sherlock Holmes "... while man is an insoluble puzzle, in the aggregate he becomes a mathematical certainty. You can, for example, never foretell what any one man will do, but you can say with precision what an average number will be up to. Individuals vary, but percentages remain constant. So says the statistician"
Overview • General Statistics • The Normal Distribution • Z-Tests • Confidence Intervals • T-Tests
General Statistics ~ THE GOLDEN RULE ~ Statistics NEVER replace the judgment of the expert.
Approach to Statistical Research • Formulate a Hypothesis • State predictions of the hypothesis • Perform experiments or observations • Interpret experiments or observations • Evaluate results with respect to hypothesis • Refine hypothesis and start again (Basically the same as all other research)
Hypothesis Testing H0 :Null Hypothesis, status quo HA : Alternative Hypothesis, research question So, either : "The data does not support H0" or "We fail to reject H0"
Types of Data • Continuous • height, age, time • Discrete • # of days worked this week, # leaves on a tree • Ordinal • {Good, O.K., Bad} • Nominal • {Yes/No}, {Teacher/Chemist/Haberdasher}
Pie Charts • Nominal/Ordinal • Only suitable for data that adds up to 1 • Hard to compare values in the chart
Bar Charts • Nominal/Ordinal • Easier to compare values than pie chart • Suitable for a wider range of data
Dot Plots • Nominal/Ordinal • Represents all the data • Difficult to read
Box Plots • Nominal/Ordinal • 1IQR, 3IQR • Outliers
Scatter Plots • Excellent for examining association between two variables
Histograms • Continuous Data • Divide Data into ranges
Time-Series Plots • Time related Data • e.g. Stock Prices
Question 1 In a telephone survey of 68 households, when asked do they have pets, the following were the responses : • 16 : No Pets • 28 : Dogs • 32 : Cats Draw the appropriate graphic to illustrate the results !!
Question 1 - Solution Total number surveyed = 68 Number with no pets = 16 =>Total with pets = (68 - 16) = 52 But total 28 dogs + 32 cats = 60 => So some people have both cats and dogs
Question 1 - Solution How many? It must be (60 - 52) = 8 people • No pets = 16 • Dogs = 20 • Cats = 24 • Both = 8 ------------------------- Total = 68
Question 1 - Solution Graphic: Pie Chart or Bar Chart
The Literary Digest Poll • 1936 US Presidential Election • Alf Landon (R) vs. Franklin D. Roosevelt (D)
Literary Digest had been conducting successful presidential election polls since 1916 They had correctly predicted the outcomes of the 1916, 1920, 1924, 1928, and 1932 elections by conducting polls. These polls were a lucrative venture for the magazine: readers liked them; newspapers played them up; and each “ballot” included a subscription blank. The Literary Digest Poll
The Literary Digest Poll • They sent out 10 million ballots to two groups of people: • prospective subscribers, “who were chiefly upper- and middle-income people” • a list designed to "correct for bias" from the first list, consisting of names selected from telephone books and motor vehicle registries
The Literary Digest Poll • Response rate: approximately 25%, or 2,376,523 responses • Result: Landon in a landslide (predicted 57% of the vote, Roosevelt predicted 40%) • Election result: Roosevelt received approximately 60% of the vote
The Literary Digest Poll • POSSIBLE CAUSES OF ERROR • Selection Bias: By taking names and addresses from telephone directories, survey systematically excluded poor voters. • Republicans were markedly overrepresented • in 1936, Democrats did not have as many phones, not as likely to drive cars, and did not read the Literary Digest • “Sampling Frame” is the actual population of individuals from which a sample is drawn: Selection bias results when sampling frame is not representative of the population of interest
The Literary Digest Poll • POSSIBLE CAUSES OF ERROR • Non-response Bias: Because only 20% of 10 million people returned surveys, non-respondents may have different preferences from respondents • Indeed, respondents favored Landon • Greater response rates reduce the odds of biased samples
Terminology • Population: is a set of entities concerning which statistical inferences are to be drawn. • Sample: a number of independent observations from the same probability distribution • Parameter: the distribution of a random variable as belonging to a family of probability distributions, distinguished from each other by the values of a finite number of parameters • Bias: a factor that causes a statistical sample of a population to have some examples of the population less represented than others.
Outliers (and their treatment) • An "outlier" is an observation that does not fit the pattern in the rest of the data • Check the data • Check with the measurer • If reason to believe it is NOT real, change it if possible, otherwise leave it out (but note). • If reason to believe it is real, leave it out and note.
The Mean • The Mean (Arithmetic) • The mean is defined as the sum of all the elements, divided by the number of elements. • The statistical mean of a set of observations is the average of the measurements in a set of data
The Variance • But there can be a lot of variance in individual elements, e.g. teacher salaries Average = €22,000 Lowest = € 12,000 Difference = 12,000 - 22,000 = -10,000
The Variance • Sum of (Sample - Average) = 0, thus we need to define variance. • The variance of a set of data is a cumulative measure of the squares of the difference of all the data values from the mean divided by sample size minus one.
Standard Deviation • The standard deviation of a set of data is the positive square root of the variance. - 1 - 1
Question 2 • Find the mean and variance of the following sample values : 36, 41, 43, 44, 46
Question 2 • Mean: (36 + 41 + 43 + 44 + 46)/5 = 42 • Variance Difference Square • 36 – 42 = -6 36 • 41 – 42 = -1 1 • 43 – 42 = 1 1 • 44 – 42 = 2 4 • 46 – 42 = 4 16 • ---------------------------------------- • 58 • 58 / (5 -1) = 58 / 4 = 14.5
The Normal Distribution • The graph has a single peak at the center, this peak occurs at the mean • The graph is symmetrical about the mean • The graph never touches the horizontal axis • The area under the graph is equal to 1
Characterization • A normal distribution is bell-shaped and symmetric. • The distribution is determined by the mean mu, m, and the standard deviation sigma, s. • The mean mu controls the center and sigma controls the spread.
The Normal Distribution • If a variable is normally distributed, then: • within one standard deviation of the mean there will be approximately 68% of the data • within two standard deviations of the mean there will be approximately 95% of the data • within three standard deviations of the mean there will be approximately 99.7% of the data
Why? • One reason the normal distribution is important is that many psychological and organsational variables are distributed approximately normally. Measures of reading ability, introversion, job satisfaction, and memory are among the many psychological variables approximately normally distributed. Although the distributions are only approximately normal, they are usually quite close.