Download
1 / 12
120 likes | 218 Vues
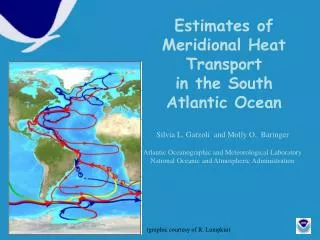
Estimates of Meridional Heat Transport in the South Atlantic Ocean. Silvia L. Garzoli and Molly O. Baringer Atlantic Oceanographic and Meteorological Laboratory National Oceanic and Atmospheric Administration. (graphic courtesy of R. Lumpkin). 17 sections in the South Atlantic.

E N D
Estimates of Meridional Heat Transport in the South Atlantic Ocean Silvia L. Garzoli and Molly O. Baringer Atlantic Oceanographic and Meteorological Laboratory National Oceanic and Atmospheric Administration (graphic courtesy of R. Lumpkin)
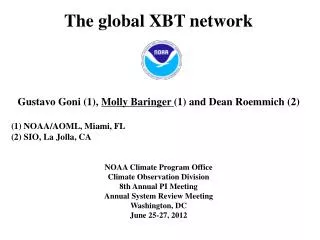
17 sections in the South Atlantic High Density XBT Lines
Time series of the total heat transport (top panel) at 30°S (solid) and 35°S (dashed) obtained from the POCM velocity and temperature fields. In parenthesis after the mean value of the series, is the standard deviation. The lower panel is the climatological annual cycle of the heat transport (1986-1998) computed from the full time series at 30°S (represents 31% of the RMS variance) and at 35°S (represents 17% of the RMS variance).
Table III: Results from the analysis of the POCM model. A: Comparison between the results from direct calculation of the transport using the model velocities and from the geostrophic method using the model velocity to determine the reference level all locations. B: Comparison between the results from direct calculation of the transport using the model velocities and from the geostrophic method using with =37.09 kg m-3 as reference level. C: Comparison between the results from direct calculation of the transport using the model velocities and from the geostrophic method using with =37.09 kg m-3 as reference level and a mean bottom velocity in the western boundary
Uncertainty estim a te PW Upper Ocean Salinity 0.03 Deep Climatology below 850 meters 0.15 Bottom depth 0.02 Western Boundary mean velocity 0.02 Ek man 0.04 Unresolved shelf transport 0.01 Ageostrophic non - Ekman 0.05 Reference velocity 0.05 Total 0.18 Summary of uncertainties Error estimates for the heat transport values
South Atlantic Heat Transport from XBTs Solid blue line: Total heat transport; Dashed black line: geostrophic component; Dashed red line: Ekman component. All values are in PW (1PW = 1015 Watts).
Variability with latitude Total (blue) and Geostrophic (red) fluxes.
Annual cycle of the total heat transport, the geostrophic heat transport and the Ekman heat transport.
Objectives • Data for Model Calibration and Validation • Carbon system studies: • Changes in anthropogenic carbon inventory • Transport of carbon, oxygen and nutrients • Large scale natural and anthropogenic variability of biogeochemical properties • Heat and freshwater storage and flux studies: • Divergence of transport-surface fluxes • Transport of heat and salt • Storage of heat and freshwater • Globally changing inventories of heat and freshwater • Deep and shallow water mass and ventilation studies: • Changes in subduction and formation rates • Effective spreading rates • Pathways of ventilation • Rates of dilution • Water mass ages • Calibration of autonomous sensors: • ARGO salinity sensors • Biogeochemical moorings and floats • Relationships between sensors and other properties
Proposed NOAA CLIVAR/CO2 Repeat Hydro cruises A16N July 2012 A5 July 2011 A13.5 March 2009 P18S Jan 2008 A10 March 2010