Download
1 / 11
110 likes | 184 Vues
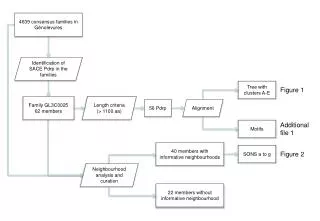
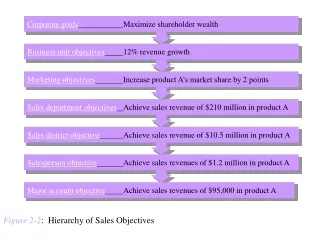
Explore hierarchy of sales objectives, strategies, and budgeting to maximize revenue and market share. Adapt corporate goals to drive sales growth effectively. Identify key areas to align with company targets.

E N D
Corporate goalsMaximize shareholder wealth Business unit objectives12% revenue growth Marketing objectivesIncrease product A’s market share by 2 points Sales department objectivesAchieve sales revenue of $210 million in product A Sales district objectiveAchieve sales revenue of $10.5 million in product A Salesperson objectiveAchieve sales revenues of $1.2 million in product A Major account objectiveAchieve sales revenues of $95,000 in product A Figure 2-2: Hierarchy of Sales Objectives
Major Accounts Middle Accounts Size of Account Minor Accounts Number of Accounts Figure 2-6: Customer Base Traingle
Chapter 2 Strategic -Mission management -Goals planning -Strategies Strategic -Situation analysis marketing -Segmentation & target marketing planning -Marketing mix program Sales force -Market access strategy strategy -Account relationship strategy Operating -Promotion budgets -Selling expense
Michael E. Porter’s Three Generic Strategies 1 Cost leadership 2 Differentiation Broad Target Competitive scope 3a. Cost focus 3b. Differentiation focus Narrow target Lower cost Differentiation Competitive Advantage Source: From Michael E. Porter, Competitive Advantage, New York; Free Press, 1985, p.12.
Table 2-1 Sales Manager’s and Marketing Executive’s Product Classifications by Strategy Sales manager Classification Build Strategy Hold Strategy Harvest Strategy Divest Strategy Total Marketing executive classification Build strategy 71ª 29 10 21 129 22 2 0 95 Hold strategy 57 3 1 88 Harvest strategy 49 23 6 88 Divest strategy 21 27 2594 Total 149 55 32 365 ªA total of 71 sales managers classified their products as build strategies out of 95 so classified by marketing executives. Source: William Strahle. An Exploratory Study of the Relationship Between Marketing and Slaes Strategy (Bloomington: School of Business, Indiana University, unpublished doctoral dissertation, 1989), p. 153.
vs. Source: Presentation by Frederick Webster, “Relationships in Marketing” at Summer Marketing Educator’s Conference, August 8, 1993. Figure 2-7: Traditional versus Relationship Marketing
Alternative Types of Account Relationships Programmatic Purchasing Approach Strategic Partners 3% Major Accounts 7% Contractual Relationships 20% Repeat Transactions 70% Transactional Selling approach Reactive: respond to demand Partnering: create demand Programmatic
Design marketing program Set advertising and promotion expenditure levels Forecast sales Revise expenditure categories Request additional funds as needed Estimate personal selling costs needed to reach sales goals Compare actual expenditures with plans Figure 2-8: The Sales Budgeting Process
Selling Expenses as a Percent of Sales COMPANY SIZE: Under $5 Million (MM) 14.7% $5 - $25 MM 10.5% $25 - $100 MM 7.9% $100 - 250 MM 3.5% Over $250 MM 6.8% PRODUCT OR SERVICE: Industrial Products 4.1% Industrial Services 6.4% Office Products 9.4% Office Services 8.1% Consumer Products 5.4% Consumer Services 7.9%
Selling Expenses as a Percent of Sales Selling Expenses as a Percent of Sales INDUSTRY: Business services 1.7% Communications 9.8% Educational services 47.9% Electronics 4.2% Fabricated metals 10.8% Health services 19.9% Hotels 21.4% Machinery 10.1% Manufacturing 13.6% Office equipment 9.0% Paper and allied products 6.8% Wholesale (Consumer goods) 3.7% Wholesale (Industrial goods) 9.5% Average 6.9%
Translating Corporate Objectives into Sales Strategies Secure Added Distribution Outlets Sell New Products to Existing Account Maintain List Prices and Reduce Costs Offer Low Prices to Attract Business Promote Product Variations and Improvements Emphasize Advertising Support Demonstrate Superior New Product Benefits Offer Easy Credit Terms Identify and Promote Alternative Uses Offer Promotional Allowances and Help with Displays Offer Key Account or National Account Services Corporate Objectives Become a major Supplier of Consumer Leisure Products and Services Marketing Strategies Hold Harvest Divest Build Trim Product Line and Push Volume Items Service Current Target Accounts Help Dealers Clear Out Inventory Reduce Selling Costs Help Dealers Find Substitutes or New Suppliers Sales Strategies Call on Large Accounts Sell Excess Inventory to Export Markets or Jobbers Emphasize Advertising Support Show Superior New Product Benefits Offer Easy Credit Terms Offer Trade Deals to Gain Acceptance