Download
1 / 27
270 likes | 425 Vues
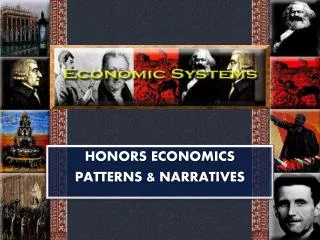
HONORS ECONOMICS PATTERNS & NARRATIVES. SUPPLY & DEMAND. PRICE. DEMAND. SUPPLY. SUPPLY & DEMAND BASICS. In a market system INTERSECTION of supply & demand curves = PRICES Marginal COST (supply) = marginal VALUE (demand) Price = y-axis / quantity = X-AXIS. ACCORD – 5 MODELS.

E N D
HONORS ECONOMICS PATTERNS & NARRATIVES
SUPPLY & DEMAND PRICE DEMAND SUPPLY
SUPPLY & DEMAND BASICS In a market system INTERSECTION of supply & demand curves = PRICES Marginal COST (supply) = marginal VALUE (demand) Price = y-axis / quantity = X-AXIS
ACCORD –5 MODELS Auctioneer(Leon Walras) = series of simultaneous equations solved by the “invisible hand” auctioneer. Cobweb(Nicholas Kaldor) = inward & outward spirals based on the mismatch of long-run & short-run supply / elasticities of supply & demand COrridor(Axel Leijonhufvud) = behaves like the “Rocking Horse” within range of the corridor, however, inflationary & deflationary traps exist outside its range. Equilibrium & Disequilibrium Special States Rocking Horse (Ragnar Frisch – Jan Tinbergen) = shock-absorber & thermostat. Price system propagates exogenous shocks, but tends toward long-run equilibrium. Disco(Peter Diamond) = Search Equilibrium; Matching & Pairing. Multiple equilibria with unstable optimal & stable-suboptimal equilbria. Often, what you want, you can’t have; what you have, you don’t want. Markets must be made.
DEMAND Demand curves slope DOWNWARDS – buy more when prices are lower Shape of the aggregate DEMAND curve = WEALTH, population, & the availability of SUBSTITUTES
SUPPLY SHAPE of the supply curve = FACTORS of production (land, labor, & capital) + TECHNOLOGY + substitutes Supply curves slope UPWARDS – produce more when prices are higher Samantha’s Applause Supply Curve $ 5 Mystery Item Brandon’s Applause Supply Curve $ 1 Mystery Item Francine’s Applause Supply Curve Alyssa’s Applause Supply Curve?
INCREASING/DIMINISHING RETURNS SUPPLY & DEMAND ILLUSTRATE “NO FREE LUNCH” EVERYTHING HAS OPPORTUNITY COSTS AS COSTS (PRICE) OF CONSUMPTION / PRODUCTION INCREASE THEY CONSUME / PRODUCE LESS. INCREASING RETURNS: • DIVISION OF LABOR: UNIT COSTS DECREASE AS PRODUCTION INCREASES • RESOURCE CONSTRAINTS: PRICE INCREASES AS RESOURCE STOCKS DIMINISH • EDUCATION: PREVIOUS KNOWLEDGE QUICKER ACQUISITION OF NEW KNOWLEDGE • NETWORK EFFECTS: THE VALUE OF THE NEWORK = NUMBERS OF MEMBERS. DECREASING RETURNS: • DECREASING MARGINAL UTILITY: THE 10THSLICE OF PIZZA DOES NOT TASTE AS GOOD AS THE 1ST • CROWDING/CONGESTION: TRAFFIC; CLUBS; FASHION • COST DISEASE: OVERBUREACRATIZATION / PROFESSIONALIZATION
SUPPLY & DEMAND Mr. Brunelli Demands Higher Grades, but the Supply Function for Students is a “kinked” step function A DEMAND B SUPPLY PRICE C D PRICE
AUCTIONEER MODEL 6 F(d)Marcie = 1a + 2b + -1.5c = 6 F(d)Patti = -2a + 1b + 1c = 8 ; F(d)Lucy = 4a + 1b + 0.5c = 2 8 2 F(d)Violet = 4a + 0.6b + 3c = 5 5 1 F(d)Frieda = 8a + 1b + 2c = 1 “Outer” Beauty = A = -1 “Inner” Beauty = B = 5 $$$$$ = C = 2
AUCTIONEER MODEL A B C Walrasian Auctioneer = individual consumer demand functions & individual producer supply functions matrix of SIMULTANEOUS equations aggregate functions Then, F(D) [Aggregate Demand) = F(S) (Aggregate Supply) “ONE PRICE” Assumptions: Determinate, one unique solution, system in equilibrium, no transaction costs.
ROCKING HORSE MODEL BIG SHOCK
ROCKING HORSE MODEL Fluctuations in price = EXOGENOUS shocks propagated through the rocking horse. Exogenous Shocks = • Supply shortages from War, Famine, & Weather • New Technology • Government Policy • Changes in Credit / Money • Structural Changes in the Economy (Agriculture Industry) Market system tends toward long-run EQUILIBRIUM. Rocking Horse = SHOCK ABSORBER, internal economic mechanism (PRICE SYSTEM) never wrong. Economy = CYBERNETIC = Self-Adjusting & Self-Regulating Thermostat Friction = “PRICE DISCOVERY”
“DISCO” MODEL l STABLE – SUBOPTIMAL EQUILIBRIUM G I R L S UNSTABLE – OPTIMAL EQUILIBRIUM STABLE – SUBOPTIMAL EQUILIBRIUM BOYS
“DISCO” MODEL l I N S U R E R S INSUREES
“DISCO” MODEL Small Shock Small Shock Sellers = Buyers Unstable, Optimal Equilibrium Sellers, No Buyers Stable, Suboptimal Equilibrium Buyers, No Sellers Stable, Suboptimal Equilibrium
“DISCO” MODEL Supply & Demand = SEARCH EQUILIBRIUM; Pairing & Matching • Workers & Employers • Insurers & Insurees • Schools & Students • Entrepreneurs & Capital Markets & Non-Markets: Markets cannot be assumed, they must be CREATED. MULTIPLEequilibria: Stable, SUBOPTIMALequilibria + Unstable, optimal equilibrium. Disequilibrium = natural state of affairs. Economic Agents ≠ PERFECT INFORMATION. Information / Transactions = Costly
CORRIDOR MODEL ACCELERATING INFLATION ACCELERATING DEFLATION CORRIDOR • DEFLATIONARY • SHOCK • DEBT • REDUCTION • IN SPENDING • REDUCTION • IN CREDIT / • INVESTMENT • LEISURE / • TECHNOLOGY • SHOCK • INFLATIONARY SHOCK • DEFAULT • CURRENCY • SPREAD • WAGE SPIRAL • COMMODITY • PUSH • INFLATION • 2% -- 10% • UNEMPLOYMENT • 10% -- 5% DEFLATIONARY TRAP a.k.a. “LIQUIDITY” TRAP INFLATIONARY TRAP a.k.a. “GALLOPING” INFLATION
CORRIDOR MODEL Most fluctuations occur in narrow BANDS or “corridors” The Federal Reserve = control interest rate = SPEED-BUMP or guardrail. Within these ranges, economy = “rocking horse” model, but . . . High and low levels of INFLATION / UNEMPLOYMENT = runaway feedback effects. EXPECTATIONS are important. SELF-FULFILLING PROPHECIES The economy behaves normally, IF we believe it behaves normally. Expected Inflation Inflation Expected Deflation Deflation Shocks = not SELF-CORRECTING
ELASTICITY Vertical = perfectly INELASTIC (e = 0) Demand = addictive behavior • ADDICTIONS • Your life / health Supply = TECHNOLOGICAL / Resource Constraint • In this house we obey the laws of thermodynamics! • Water in a desert Horizontal = perfectly elastic (e = ∞) demand = fixed price • Perfectly SUBSTITUTABLE GOODS = paper clips • BUDGET CONSTRAINT supply = fixed costs • Commodities – identical production processes • LIQUIDITY TRAPS • “COST – DISEASE” of service workers / professionals ELASTICITY = sensitivity of quantity to price E I
INELASTIC DEMAND “New” Diagnoses PRICE INELASTIC DEMAND SUPPLY
GIFFEN GOODS / CONSPICUOUS CONSUMPTION PRICE SUPPLY DEMAND
POSITIONAL & NON-POSITIONAL Demand = positively elastic GIFFEN GOODS Higher price higher quantity demanded • Use vs. Exchange value: (fetish commodities) demand ≠ value, price value demand • CONSPICUOUS consumption: consume for others’ benefit: flowers/chocolates, perfume, WEDDING REGISTRIES. • Food / consumption staples: largest budget item displaces others as price increases. • Status/POSITIONAL goods: is the best worth it? • Is private school worth the tuition? • Is expensive healthcare better healthcare? • McMansions anyone? Positional goods = socially sanctioned MASOCHISM Socially INEFFICIENT use of resources
COBWEBS If slopesupply > slopedemand INWARD spiral to PRICE STABILITY If slopesupply < slopedemand OUTWARD spiral to PRICE INSTABILITY Caused by time LAG between supply & demand decisions • Agriculture – planting (costs) & HARVESTING (benefits) • LABOR MARKETS – education (costs) & compensation (benefits) • Stock markets (esp. Technology) – investment (costs) & return (benefits)
COBWEBS & PRICE FLUCTUATIONS PRICE TIME
CONSUMER & PRODUCER SURPLUS CONSUMER SURPLUS = AREA BETWEEN DEMAND CURVE & EQUILIBRIUM PRICE PRODUCER SURPLUS (PROFITS) = AREA BETWEEN THE SUPPLY CURVE & EQUILIBRIUM PRICE ***IN A CAPITALIST – COMPETITIVE – MARKET ECONOMY, THERE SHOULD BE NO LONG-TERM PROFITS***
INEQUALITY & DISTRIBUTIONS INEQUALITY = DISPROPORTIONATE OR “UNFAIR” CONCENTRATION OF VALUED ITEMS – INCOME, JOBS, GRADES – IN ONE GROUP INCOME INEQUALITY = MEASURED BY GINI COEFFICIENT GINI = GAP BETWEEN “PERFECT EQUALITY” & THE ACTUAL LORENZ CURVE CUMULATIVE SHARE OF INCOME EQUALITY = LEPTOKURTIC, HOMOSKEDASTIC DISTRIBUTION MODE MEANMEDIAN INEQUALITY = PLATYKURTIC, HETEROSKEDASTIC DISTRIBUTION MEAN MEDIAN (SKEW) & MULTIPLE MODES KURTOSIS = SINGULAR OR MULTIPLE MODES SKEWNESS = MEAN VALUE RELATIVE TO MEDIAN VALUE MEAN > MEDIAN SKEW RIGHT MEAN < MEDIAN SKEW LEFT GINI GINI