Scientific Notation and Graphing
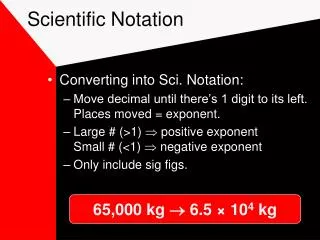
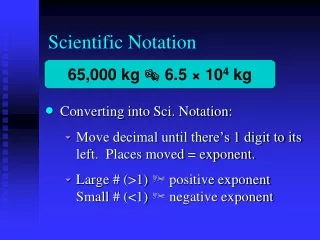
Scientific Notation and Graphing. Scientific Notation. Use to express very large or small numbers 60221415000000000000000 or 6.02x10 23 0.000000000000000000435 or 4.35x10 -19. Scientific Notation.

Scientific Notation and Graphing
E N D
Presentation Transcript
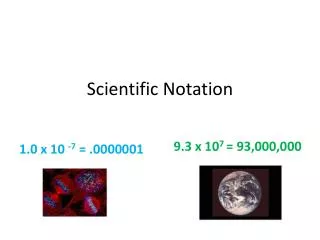
Scientific Notation • Use to express very large or small numbers • 60221415000000000000000 or 6.02x10²³ • 0.000000000000000000435 or 4.35x10⁻¹⁹
Scientific Notation Scientific (Exponential) notation is a system in which a number is expressed as a product of a number between 1 and 9multiplied by 10 raised to a power (exponent).
Scientific Notation • C x 10n • C= the coefficient= only the significant figures are used • n= the exponent (power)= location of the decimal point
Scientific Notation 1. The value of the exponent is determined by counting the number of places the original decimal point must be moved to give the coefficient. Remember that the coefficient must be a number from 1 to 9.
Scientific Notation 2. If the original number (in standard notation)is greater than 1, the exponent is a positive number. 60221415000000000000000 or 6.02x10²³ 3. If the original number is less than 1, the exponent is a negative number. 0.000000000000000000435 or 4.35x10⁻¹⁹
Example 1 • Write 628,000 in scientific notation a. Determine the number of sig figs __ 3 b. Write the coefficient ____ 6.28 c.Determine the number of places to move the decimal point __ 628000 larger than 1 = positive exponent 5 Answer = 6.28 x 10⁵
Example 2 • Write 0.00260 in scientific notation a. Determine the number of sig figs __ 3 b. Write the coefficient ____ 2.60 c. Determine the number of places to move the decimal point __ 0.00260 smaller than 1 = negative exponent 3 Answer = 2.60 x 10 -3
Write the Following in Scientific Notation • 2305.7 • 2.3057 x 10³ • 3,000,000 • 3 x 10⁶ • 300. • 3.00 x 10² • 0.00010 • 1.0 x 10⁻⁴ • 402.0 • 4.020 x 10² • 0.1005 • 1.005 x 10⁻¹ • 3.57 • 3.57 or 3.57 x 100
Scientific Notation • To convert from scientific notation back to standard (ordinary) notation: • Simply move the decimal point the number of places indicated by the exponent. • Positive exponent= make number larger • Move decimal to the right • Negative exponent= make number smaller • Move decimal to the left
Write the Following in Standard Notation a. 3.4 x 10³ 3400 b. 8.10 x 10⁻² 0.0810 c. 5.600 x 10³ 5600. d. 6.5 x 10⁻⁴ 0.00065 e. 5 x 10⁶ 5,000,000
Graphing • Circle graph (also called pie chart) Used to show parts of a fixed whole. Usually parts are labeled as percents with the circle representing 100%.
Graphing b. Bar graph- good for showing quantitative data or data that you can count at exact intervals Ex. Rain fall total each month
Graphing • Line graph- good for showing relationship between two variables • Independent variable is plotted on the X axis • Dependent variable is plotted on the Y axis Best fit line is drawn so that as many points fall above the line as below
Graphing • Directly related • Positive slope • As Xincreases, Yincreases
Graphing • Inversely related • Negative slope • As X value increases, Ydecreases
Friday Night Birdville Richland