Download
1 / 1
10 likes | 105 Vues
Explore UVM's journey towards energy efficiency, renewable sources, transportation sustainability, and emissions reduction. Learn about green practices from 1990 to ongoing projects.

E N D
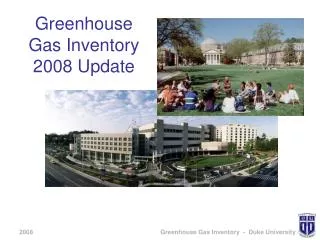
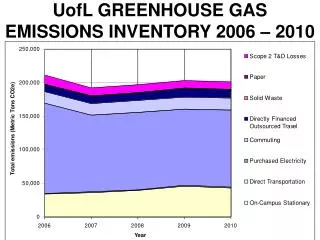
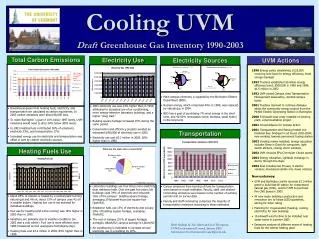
UVM Actions • 1990 Energy policy established, $125,000 revolving loan fund for energy efficiency, hired energy manager • 1992 Trustees established $1million energy efficiency bond; $500,000 in 1995 and 1998; $1.5 million in 2002 • 1992 UVM joined Campus Area Transportation Management Association, started campus buses • 2001 Trustees resolved to continue dialogue about the community energy project from the McNeil Electric Generating Station in Burlington • 2000 5-kilowatt solar array installed on heating plant, a demonstration project • 2001 Joined Alliance for Climate Action • 2001 Transportation and Parking tested one biodiesel bus; biodiesel in all buses 2002-2004; now working towards permanent fueling station • 2003 Vending misers installed; energy education includes Sleep is Good for computers, light switch stickers, closing storm windows • 2003 UVM receives EPA Commuter Choice award • 2004 Energy education, lightbulb exchange in dorms through Eco-Reps • 2004 fleet includes two Priuses, 9 electric vehicles; downsized vehicle mix, fewer vehicles • Now underway: • UVM and Burlington jointly received $2.1million grant to build fast-fill station for compressed natural gas (CNG), and for UVM to purchase five CNG buses in 2005 • All new major building construction and renovation are to follow LEED guidelines, aiming for Silver rating • Planning for tri-generation (heating, cooling, electricity) for new buildings • 10-kilowatt wind turbine to be installed near water tower in summer 2005 • Emissions analysis of different mixes of heating fuels for the central heating plant Transportation • Carbon emissions from burning of fuels for transportation were based on rough estimates. Faculty, staff, and student commuting emissions were based on the number of parking permits and on survey data. • Faculty and staff commuting comprises the majority of transportation emissions according to these estimates. Cooling UVMDraftGreenhouse Gas Inventory 1990-2003 Total Carbon Emissions Electricity Use Electricity Sources • Main campus electricity is supplied by the Burlington Electric Department (BED). • Nuclear energy, which comprised 45% in 1999, was replaced by natural gas in 2004. • BED has a goal of purchasing 7% wind energy in the short term, and 40-50% renewables (wind, biomass, small hydro) in the long term. • 2003 electricity use was 24% higher than in 1990, attributed to increased use of air conditioning, more energy-intensive laboratory buildings, and a higher “plug load.” • Building square footage increased 15% during the same period. • Conservation and efficiency projects avoided an estimated $780,000 of electricity use in 2003. • Electricity use cost $5.2 million in 2003, 38% higher than in 1990. • Greenhouse gases from heating fuels, electricity, and transportation are calculated as carbon equivalents. In 2003 carbon emissions were about 68,000 tons. • To reach Burlington’s goal of 10% below 1997 levels, UVM emissions would need to drop 24% below 2003 levels. • In 2003 heating fuels contributed 50% of emissions; electricity 33%, and transportation 17%. • Increased energy use for electricity and transportation was offset in part by cleaner electricity sources. Heating Fuels Use • Laboratory buildings use four times more electricity than residence halls. Over the past five years, lab buildings used 34% of electricity and occupied 16% of the campus’ building square footage, averaging 29 kilowatt-hours per square foot (kwh/ft2). • Residence halls use 15% of electricity and occupy 29% of building square footage, averaging 7kwh/ft2. • The rest of campus (51% of square footage) averages 10kwh/ft2; campus average is 13kwh/ft2 • Air conditioning is estimated to increase annual electricity use in a building by 10%. • About 85% of campus is heated by a central plant burning natural gas and #6 oil; about 15% of campus uses #2 oil in smaller boilers. Heating fuel use is not metered for individual buildings. • Fuel use for heating (and some cooling) was 16% higher in 2003 than in 1990. • Variations are primarily due to weather conditions (ex: 2003 was a cold winter). Fuel use is more efficient since 1990 (measured as fuel use/square foot/degree day). • Heating fuels cost $3.2 million in 2003, 83% higher than in 1990. Draft findings by Zak Adams & Gioia Thompson, UVM Environmental Council, January 2005. Information: Environmental.Council@uvm.edu