Download

1 / 12
120 likes | 315 Vues
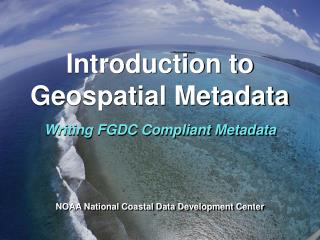
NOAA’s Coastal Change Analysis Program (C-CAP). http://www.csc.noaa.gov/landcover. Monitoring the Nation’s Coasts. Wando River Watershed, SC. The Wando River watershed, northeast of Charleston, South Carolina.

E N D
NOAA’sCoastal Change Analysis Program(C-CAP) http://www.csc.noaa.gov/landcover
Monitoring the Nation’s Coasts Wando River Watershed, SC • The Wando River watershed, northeast of Charleston, South Carolina. • The Wando River empties into Charleston Harbor. It is linked via historic rice canals to the Awendaw Creek, which empties into Bulls Bay on the coast. • U.S. Highway 17 runs Southwest/Northeast through the center of this study area. • The combined area encompasses about 135,000 acres of land area.
Land Cover Legend • This legend corresponds to the land cover displayed in the following slides (graphics on the right hand of slides), and in the tif files with include lc in their file names.
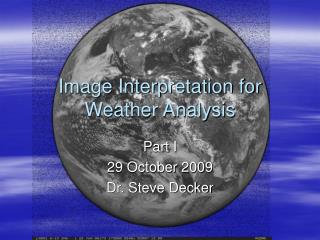
Brief Discussion of Imagery What are the Images? • The imagery displayed in the following slides (graphics on the left hand of slides), and in the tif files with include img in their file names are false color composites. • They are called composite images because they are made up of three separate images. These separate images are a measure of energy from several portions of the electromagnetic spectrum (EMS). • In the case of these images, information from the visible and near-infrared portions of the spectrum are displayed. • The satellites used for these examples, and most of C-CAP’s mapping, is from a series of satellites called Landsat. Landsat collects information in the visible (blue, green, red), near-infrared, middle infrared and thermal portions of the EMS. • All of this information, as well as information concerning elevation is used with detailed field data to produce these land cover classifications.
Brief Discussion of Imagery What Does it Mean? • Shades of red highlight live vegetation. • Made-made materials, and bare earth appear in shades of blue or gray. • Water appears as a dark blue or black. • Wetlands appear as the darker areas visible within the water where water meets the land.
Suburban Residential Development 1972 1986 1990 1995 2000 Mount Pleasant, SC
C-CAP Web Pages with Examples • http://www.csc.noaa.gov/crs/lca/change_analysis.html • http://www.csc.noaa.gov/crs/lca/trend_analysis.html