Download
1 / 52
540 likes | 936 Vues
In the Name of the Most High. Remote Monitoring (RMON). by Behzad Akbari Fall 2011. These slides are based in parts upon slides of Prof. Dssouli (Concordia university ). Basic Concepts RMON Goals Control of Remote Monitors Multiple Managers Table Management Statistics group

E N D
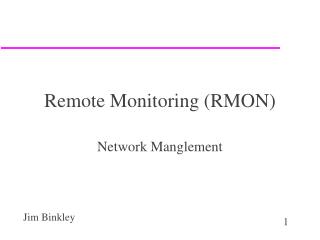
In the Name of the Most High Remote Monitoring (RMON) by BehzadAkbari Fall 2011 These slides are based in parts upon slides of Prof. Dssouli (Concordia university)
Basic Concepts RMON Goals Control of Remote Monitors Multiple Managers Table Management Statistics group History group Host and hostTopN groups Matrix group Alarm group Filter and packet Capture group RMON2 Outline
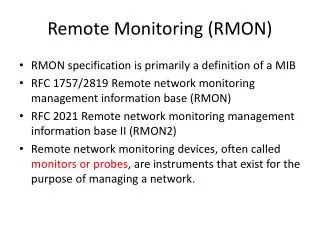
Basic Concepts • Remote Network Monitoring (RMON): monitoring the state of a network and its nodes through a remote probe. • Why? • Significantly reduces SNMP traffic due to local polling. • No need for agent to be visible to managers all the time. • Reduces Ping messages. • Continuous monitoring of individual segments • Has been shown to increase productivity for network administrators. • Extends the SNMP functionality without changing the protocol • Defines a Remote MONitoring (RMON) MIB that supplements MIB-II • with MIB-II, the manager can obtain information on individual devices only • with RMON MIB, the manager can obtain information on the LAN as a whole • Components: • Data gatherer (monitor): a physical device • Data analyzer: processor that analyzes data • RMON does both and reports to a manager
A monitor generally can produce summary information on error statistics, e.g., counts # of collisions on a LAN Performance statistics: #packets delivered per second, packet size distribution, etc. A monitor also can store packets for later analysis A Monitor may also filter data to limit the # packets counted or captured filter based on packet type or characteristics (e.g., packets with certain source address, erroneous packets) Basic Concepts
A Monitor is required per subnetwork A monitor could either be a standalone device whose only job is monitoring and traffic analysis or it could also be a device with other functionalities (e.g., router, server) A monitor usually communicates with one (or more) central MS (Management Station) RMON essentially is a definition of a MIB Standard monitoring functions and interfaces for communication between SNMP consoles and remote monitors Basic Concepts
Monitoring subnetwork-wide behavior while reducing the burden on agents and managers Monitors and analyzes locally and relays data An object may not afford to run SNMP agent Continuous off-line monitoring in the presence of failures RMON should collect fault, performance, and configuration information continuously even when it is not being polled save communication cost This information may be retrieved later by a manager Proactive monitoring Continuously runs diagnostics and log network performance even in the absence of failures Upon a failure, notify the manager and provide him with useful info to be able to diagnose the fault RMON Goals
Provide value-added data Perform analysis on collected data, thus relieving the MS from this responsibility For example, a monitor can analyze subnetwork traffic to determine which hosts generate the most traffic or errors on the subnetwork. Support multiple managers Multiple managers improves reliability, provides diversity in network management, etc. A monitor should be configured to deal with more than a manager simultaneously RMON Goals
Management console with RMON probe Ethernet Central Site Router Router Local management console with RMON probe Router Router Ethernet PC with RMON probe FDDI backbone Bridge Router with RMON probe Ethernet Token Ring LAN PC with RMON probe Network with RMONs
RMON is configured for data collection: RMON MIB contains a number of functional groups Each group may contain one or more “control tables” and one or more “data tables” Control tables (read-write) contain parameters describing data in data tables (read-only) Control of RMON- Configuration • A NMS sets appropriate control parameters to configure RMON to collect the desired data: • The parameters are set by adding a new row to the “control table” or by modifying an existing row • As information is collected, data is stored in rows of the corresponding “data table”
Functions performed by a monitor are defined and implemented in terms of table rows Control table may contain objects that specify the “source of data” to be collected, the “type of data”, the “collection timing”, etc. Associated with a single control row are one or more rows in one or more data tables Control of RMON- Configuration • To modify a particular data collection function: • it is necessary first to invalidate the control row • this causes the deletion of that row and the deletion of all associated rows in data tables • NMS can create a new control row with the modified parameters • NOTE: when a row of a control table is deleted, associated rows in data tables are also deleted.
RMON probe may be subject to management from multiple MSs Potential conflict and unwanted results Simultaneous requests for resources could exceed the capability of the monitor Monitor resources could be captured by a MS for a long time, preventing other MSs from accessing desired information Resources could be assigned to a MS that crashes without releasing resources Avoidance and resolution features are required Ownership label:identifies the owner of a particular row of the control table and associated function Multiple Managers
The RMON specification includes a set of textual conventions and procedural rules for row addition and deletion Textual conventions: 2 new data types OwnerString::=DisplayString EntryStatus::=INTEGER { valid (1), createRequest (2), underCreation (3), invalid (4) } Indicates the owner of a row in control table Indicates the status of the row Table Management
rm1ControlTable rmlControlIndex rmlControlParameter rmlControlOwner rmlControlStatus 1 5 monitor valid (1) 2 26 manager alpha valid (1) 3 19 manager beta valid (1) rm1DataTable rmlDataControlIndex rmlDataIndex rmlDataValue 1 1 46 2 1 96 2 2 85 2 3 77 2 4 27 2 5 92 3 1 86 3 2 26 Control and Data Table- Example
A MS uses SNMP messages to add a row into an RMON table SetRequest-PDU message will contain a list of object identifiers for all columns in the table When a monitor receives a request it must check whether there are any restrictions defined in the RMON MIB (object is not currently supported by the MIB) or any implementation specific restrictions (e.g., lack of resources) If row addition is not possible GetResponse-PDU with badValue error is returned Row Addition and deletion • Multiple managers attempt for row addition • multiple requests to create a row with same parameters, including index parameters conflict • Conflict arbitration is required • Only the first request is awarded • Row Deletion • is achieved by (the owner) setting the status object for that row to “invalid” • Row Modification • is achieved by first invalidating the row and then adding the row with new object instance values
rmon (mib-2 16) statistics (1) agent a agent b agent c history (2) alarm (3) Subnetwork X host (4) Interface 1 hostTopN (5) RMON probe matrix (6) Interface 2 filter (7) Subnetwork Y capture (8) event (9) agent e agent d tokenRing (10) RMON MIB 10 groups • Each group is used to store data and statistics derived from data collected by the monitor • A monitor may have more than one physical interface and hence may be connected to more than one sub-network
RMON MIB • Ethernet RMON: (rmon 1 - 9) • Token ring extension: (rmon 10) • RMON 2: Higher layers (rmon 3 – 7 and rmon 11 - 20) RFC 1757 (2819) Layer: 2 (Ethernet) RFC 2021 Layers: 3-7 RFC 1513
RMON Groups and Functions RMON Probe
RMON1 MIB Groups & Tables • Ten groups divided into three categories • Statistics groups (rmon 1, 2, 4, 5, 6, and 10)) • Event reporting groups (rmon 3 and 9) • Filter and packet capture groups(romon 7 and 8) • Groups with “2” in the name are enhancements with RMON2
Control and Data Tables • • Control table used to set the instances of data rows in the data table. • Can be set to gather and store different instances of data. • • Values of data index and control index are the same. Figure 8.4 Relationship between Control and Data Tables
Control Table Values • controlIndex – Integer uniquely identifying the row in the control table. • controlDataSource – identifies the source of the data being collected. • controlTableSize – identifies the entries associated with the data source. • controlOwner – entity or person that created the entry. – Can be a management station name, phone number, contact info • controlStatus – entry status of textual conversion (valid, createRequest, underCreation, invalid). • controlOther – Could be another object
Example: Matrix Control and SD Tables Figure 8.4 Relationship between Control and Data Tables
The Statistics Group • The simplest of the RMON groups. • Counters to store number of packets. • The etherStatsTable in this group has an entry for each interface. • Counts packets with characteristics defined by objects in the etherStatsTable. • There are 21 columns in the table, such as: – etherStatsOversizePackets - >1518 octets – etherStatsUndersizePackets - < 64 octets – etherStatsCRCAlignErrors – etherStatsCollision – etherStatsPkts65to127Octests – etherStatsPkts128to255Octests – etherStatsPkts256to511Octests – … • Good example of monitoring!
etherStatsTable etherStatsEntry etherStatsIndex etherStatsDataSource etherStatsDropEvents etherStatsOctets etherStatsPkts etherStatsBroadcastPkts etherStatsMulticastPkts etherStatsCRCAlignErrors etherStatsUndersizePkts etherStatsOversizePkts etherStatsFragments etherStatsJabbers etherStatsCollisions etherStatsPkts64Octets etherStatsPkts65to127Octets etherStatsPkts128to255Octets etherStatsPkts256to511Octets etherStatsPkts512to1023Octets etherStatsPkts1024to1518Octets etherStatsOwner etherStatsStatus statistics ifIndex.1. rmon 1
History Group • Enables the network manager to build a record of what is happening in the network over time. • Two tables: • historyControltable (7 columns) allows for the settings: – Data source historyControlDataSource – sampling intervals historyControlInterval – Number of sampling intervals historyContolBuckets • etherHistoryTable (15 columns) allows for Ethernetspecificsettings – how many Ethernet packets were sampled in the interval time.
historyControlTable historyControlEntry historyControlIndex historyControlDataSource historyControlBucketsRequested historyControlBucketsGranted historyControlInterval historyControlOwner historyControlStatus history etherHistoryTable etherHistoryEntry etherHistoryIndex etherHistorySampleIndex etherHistoryIntervalStart etherHistoryDropEvents etherHistoryOctets etherHistoryPkts etherHistoryBroadcastPkts etherHistoryMulticastPkts etherHistoryCRCAlignErrors etherHistoryUndersizePkts etherHistoryOversizePkts etherHistoryFragments etherHistoryJabbers etherHistoryCollisions etherHistoryUtilization rmon 2
historyControlTable historyControlEntry historyControlIndex historyControlDataSource historyControlBucketsRequested historyControlBucketsGranted historyControlInterval historyControlOwner historyControlStatus
Host Group • Identifies traffic statistics with the host that is detected on the subnet. –This group makes a connection between the host and the traffic. – We can ask a question like “Why is host A transmitting more packets than host B?” • Three tables: • hostControlTable (6 columns), records the number of hosts that have transmitted or received frames in the subnet. • hostTable (10 columns), the actual data – For each interface specified in hostControlTable, hostTable contains one row for each MAC address on that interface. – instance identifier for the hostAddress object: 1.6.0.0.163.224.24.130 • hostTimeTable (10 columns) information stored based on time, not MAC – Has the exact same information as hostTable, except it is index by creation order, not MAC address
hostControlTable hostControlEntry hostControlIndex hostControlDataSource hostControlTableSize hostControlLastDeleteTime hostControlOwner hostControlStatus hosts rmon 4 hostTimeTable hostTimeEntry hostTimeAddress hostTimeCreationOrder hostTimeIndex hostTimeInPkts hostTimeOutPkts hostTimeInOctets hostTimeOutOctets hostTimeOutErrors hostTimeOutBroadcastPkts hostTimeOutMulticastPkts hostTable hostEntry hostAddress hostCreationOrder hostIndex hostInPkts hostOutPkts hostInOctets hostOutOctets hostOutErrors hostOutBroadcastPkts hostOutMulticastPkts
hostTopN rmon 5 • hostTopNTable • hostTopNEntry • hostTopNReport • hostTopNIndex • hostTopNAddress • hostTopNRate hostTopNControlTable hostTopNControlEntry hostTopNControlIndex hostTopNHostIndex hostTopNRateBase hostTopNTimeRemaining hostTopNDuration hostTopNRequestedSize hostTopNGrantedSize hostTopNStartTime hostTopNOwner hostTopNStatus * hostTopNInPkts(1), hostTopNOutPkts(2), hostTopNInOctets(3), hostTopNOutOctets(4), hostTopNOutErrors(5), hostTopNOutBroadcastPkts(6), hostTopNOutMulticastPkts(7)
Matrix Group • This allows us to determine the source and destination of a communication. • Adds another dimension to network management in that we will know which communications are causing the most traffic, not just which hosts. • This is done using 3 tables: – matrixControlTable – matrixSDTable • Indexed by matricSDIndex, then by source address, then by destination address – matricDSTable • Indexed by matricDSIndex, then by destination address, then by source address
matrix • matrixControlTable • matrixControlEntry • matrixControlIndex • matrixControlDataSource • matrixControlTableSize • matrixControlLastDeleteTime • matrixControlOwner • matrixControlStatus rmon 6 • matrixSDTable • matrixSDEntry • matrixSDSourceAddress • matrixSDDestAddress • matrixSDIndex • matrixSDPkts • matrixSDOctets • matrixSDErrors • matrixDSTable • matrixDSEntry • matrixDSSourceAddress • matrixDSDestAddress • matrixDSIndex • matrixDSPkts • matrixDSOctets • matrixDSErrors
alarm Group • Measuring network performance consists of identifying abnormal conditions by the monitor and issuing alarms accordingly: • e.g., if there are more than 200 CRC errors (the threshold) in any 5-minute period (the sampling interval), an alarm is generated and sent to the central console. • Alarm group contains a single table alarmTable, each entry: • a variable to be monitored (alarmVariable) • INTEGER, counter, gauge, TimeTicks • A sampling interval (alarmInterval) • most recent sampled value (alarmValue) • Threshold parameters • alarmRisingThreshold, andalarmFallingThreshold • alarmStartupAlarm • 1 (risingAlarm), 2 (fallingAlarm), 3 (risingOrFallingAlarm) • alarm is generated when a row becomes active and 1st sampled value risingThreshold, or fallingThreshold or both
Fluctuations not counted! Avoid generating excessive alarms alarm Group Mode of operation: • Rising threshold (RT) and Falling threshold (FT) are defined • RT is crossed when current sampled value is greater than RT and value of last sampling interval was less than threshold • FT is crossed when current sampled value is less than FT and value of last sampling interval was greater than threshold • absoluteValue and deltaValue (difference of 2 successive intervals). Counter use deltaValue Sampled Object value Rising threshold Falling threshold Time
Filter Group rmon 7 • Filter group used to capture packets defined by logical expressions • Channel is a stream of data captured based on a logical expression • Filter table allows packets to be filtered with an arbitrary filter expression • A row in the channel table associated with multiple rows in the filter table
Filter Group • Observing only “selected packets” on a particular interface • Data filter • Screen observed packets based on a bit pattern that a portion of the packet matches (or fails to match) • Status filter • Screen observed packets based on their status (e.g., valid, CRC errors, etc.) • Example: screen those packets on some interface with certain source MAC address • Both filters can be combined (e.g., using logical AND and OR) to form a complex test to be applied to incoming packets • The stream of packets that pass the test is referred ot as the channel • The channel can be configured to generate some events when a packet passes through the channel
Filter Group • Filter Logic: Define the following variables input = the incoming portion of the a packet to be filtered filterPktData = the bit pattern to be tested for filterPktDataMask = the relevant bits to be tested for filterPktDataNotMask = indication of whether to test for a match or mismatch To test the input against a bit pattern for a match (e.g., screen packets with a specific source address) If ((input XOR filterPktData) = = 0) filterResult = match
Filter Group • A channel is defined by a set of filters • A channel is associated with an object “channelAcceptType” which determines when a packet is accepted to the channel (when there is a match or mismatch) • When a packet goes through a channel, a counter is incremented; an event may be generated in some circumstances, given that this channel has registered to generate events (event group) • The filter group has two tables: Filter Table and Channel Table
filter • channelTable • channelEntry • channelIndex • channelIfIndex • channelAcceptType • channelDataControl • channelTurnOnEventIndex • channelTurnOffEventIndex • channelEventIndex • channelEventStatus • channelMatches • channelDescription • channelOwner • channelStatus • filterTable • filterEntry • filterIndex • filterChannelIndex • filterPktDataOffset • filterPktData • filterPktDataMask • filterPktDataNotMask • filterPktStatus • filterPktStatusMask • filterPktStatusNotMask • filterOwner • filterStatus On(1) Off(2) eventReady(1), eventFired(2), eventAlwaysReady(3) acceptMatched(1), acceptFailed(2)
Capture Groups • The monitor may capture packets that pass through the filter or simply record statistics based on such packets • Two tables: bufferControlTable and captureBufferTable capture Group
event Group • eventTable: • eventDescritpion: textual description of the event • eventType: none(1), log(2), snmp-trap (3) log-and-trap(4) • log: an entry is added to the logTable for this event • snmp-trap: an SNMP trap is sent to a MS • eventCommunity: identifies the communities of MSs to receive the SNMP trap, etc. • logTable: • logTime: value of sysUpTime when this log entry was created • logDescription: description of the event that activated this entry (implementation-dependent) • logEventIndex: identifies the event that generated this log entry • Supports definition of events (problems, symptoms of problems) • An event is triggered by a condition located elsewhere in the MIB • E.g., monitoring a variable that crossed a rising threshold would cause an event to be generated • Controls the generation and notification of events • An event may cause (1) an SNMP trap message to be issued by the monitor, (2) info. to be logged
RMON2 • RMON1 dealt primarily with the OSI data link layer. • RMON2 is applicable to layers 3 and above: network to application layer. – Good for determining bandwidth use by applications. • Functions are similar to RMON1. • Nine more groups are added to RMON1. • Enhancement to RMON1 • Defined conformance and compliance.
RMON2 MIB Table 8.4 RMON2 MIB Groups and Tables
A Case Study • A study at Georgia Tech on Internet traffic • Objectives – Traffic growth and trend – Traffic patterns • Network comprising Ethernet and FDDI LANs • Tools used – HP Netmetrix protocol analyzer – Special high-speed TCP dump tool for FDDI LAN • RMON groups utilized – Host top-n – Matrix group – Filter group – Packet capture group (for application level protocols)