Download
1 / 24
250 likes | 586 Vues
An Introduction to DNA microarrays Rebecca Fry, Ph.D. http://www.buffalo.edu/UBT/UBT. What is a DNA Microarray?. genes or gene fragments attached to a substrate (glass). Tens of thousands of spots. Hybridized slide Two dyes Image analyzed. The Beginnings of Microarray Technology.

E N D
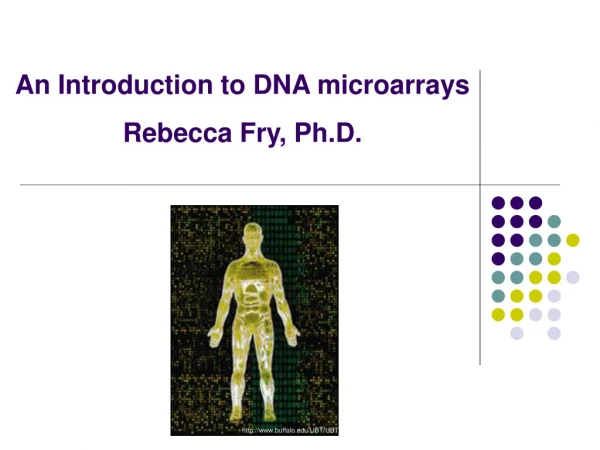
An Introduction to DNA microarrays Rebecca Fry, Ph.D. http://www.buffalo.edu/UBT/UBT
What is a DNA Microarray? genes or gene fragments attached to a substrate (glass) Tens of thousands of spots Hybridized slide Two dyes Image analyzed
The Beginnings of Microarray Technology Lockhart et al., 1996 Nature Biotechnology “Expression monitoring by hybridisation to high-density oligonucleotide arrays” Schena et al., 1995 Science “Quantitative monitoring of gene expression patterns with a complementary DNA microarray”
8 years later 4162 references
Uses and Applications Pathway mapping Target identification Gene screening Disease characterization Mechanism of Action Studies Molecular Diagnosis of Disease Personalized medicine Developmental Biology Toxicology Prediction of Drug Efficacy/Toxicity
A model experiment: Two samples of interest EGFP expressing cells EGFP KD Differential Gene Expression?! http://www.oardc.ohio-state.edu/plantranslab/gfp-a.gif Q: Which genes are differentially expressed in EGFP cells versus EGFP KD cells?
DNA nucleus cytoplasm Process of transcribing deoxyribonucleic acid to ribonucleic acid is “TRANSCRIPTION” Nucleic acids must be translated into amino acids that make up proteins Process: “TRANSLATION” RNA Cell Protein Chem.ox.ac.uk Inside every cell: DNA Serves as a genetic blueprint Dna molecule: berkeley.edu
Relating Gene Expression DNA High throughput protein assays complicated We measure transcript level RNA Is a gene expressed? Is protein produced Ideally measure protein levels Protein
Introduction Two Popular Microarraying Platforms Spotted microarrays Commercially available microarray www.molgen.mpg.de www.the-scientist.com cDNA: PCR products (500-2,000bp) synthesized oligos >10,000 probes Affymetrix “Gene Chip” 500,000 probes 25 mer (represents a fragment of a gene)
Designing Oligos 846 1 EGFP ORF ATTCTGCAGTCGACGGTACCGCGGGCCCGGGATCCACCGGTCGCCACCATGGTGAGCAAGGGCGAGGAGCTGTTCACCGGGGTGGTGCCCATCCTGGTCGAGCTGGACGGCGACGTAAACGGCCACAAGTTCAGCGTGTCCGGCGAGGGCGAGGGCGATGCCACCTACGGCAAGCTGACCCTGAAGTTCATCTGCACCACCGGCAAGCTGCCCGTGCCCTGGCCCACCCTCGTGACCACCCTGACCTACGGCGTGCAGTGCTTCAGCCGCTACCCCGACCACATGAAGCAGCACGACTTCTTCAAGTCCGCCATGCCCGAAGGCTACGTCCAGGAGCGCACCATCTTCTTCAAGGACGACGGCAACTACAAGACCCGCGCCGAGGTGAAGTTCGAGGGCGACACCCTGGTGAACCGCATCGAGCTGAAGGGCATCGACTTCAAGGAGGACGGCAACATCCTGGGGCACAAGCTGGAGTACAACTACAACAGCCACAACGTCTATATCATGGCCGACAAGCAGAAGAACGGCATCAAGGTGAACTTCAAGATCCGCCACAACATCGAGGACGGCAGCGTGCAGCTCGCCGACCACTACCAGCAGAACACCCCCATCGGCGACGGCCCCGTGCTGCTGCCCGACAACCACTACCTGAGCACCCAGTCCGCCCTGAGCAAAGACCCCAACGAGAAGCGCGATCACATGGTCCTGCTGGAGTTCGTGACCGCCGCCGGGATCACTCTCGGCATGGACGAGCTGTACAAGAAGCTTAGCCATGGCTTCCCGCCGGCGGTGGCGGCGCAGGATGATGGCACGCTGCCCATGTCTTGTGCCCAGGAGAGCGGGATGGACCGTCACCCTGCAGCCTGTGCTTCTGCTAGGATCAATGTGTAGGCGGCCGCGACTCTAGATCATAATCAGCCATACCACATTTGTAGAGGTTTTACTTGCTTTAAAAAACCTCCCACACCTCCCCCTGA 70 mer oligo specific to gene of interest
Introduction www.biorobotics.com Robotic Printing Overview of fabrication of spotted microarrays Spotted microarrays Robotics: Liquid Handling Resuspension of oligos www.qiageninstruments.com
POLQ PRKDC PRSS25 RAD1 RAD17 RAD18 RAD23A RAD23B RAD50 RAD51 RAD51C RAD51L1 RAD51L3 RAD52 RAD54B RAD54L RAD9 RECQL4 REV1L Growth arrest and DNA-damage-inducible alkB homolog Excision repair Breast cancer 1
Introduction gene RNA A closer look at Spotted microarrays Some nomenclature each spot represents a gene or gene fragment www.molgen.mpg.de “probe” “target”
Introduction emission emission cy3 and cy5: Commonly used dyes cy5 664 nm cy5 cy3 Differential dye incorporation cy5 less well than cy3 Light sensitivity: cy5 more easily degraded 562 nm 510 nm cy3 www.amersham.com
Introduction Spotted microarray target preparation Direct labeling Target preparation Labeled cDNA preparation Spotted Microarray Sample 2 EGFP EGFP KD RNA Reverse transcription Flourescent dyes cy3 cy5 cDNA cDNA Combined in equal amounts yellow cy3=cy5 red cy5>cy3 green cy3>cy5 Co-hybridized to array www.genetics.ucla.edu
Direct Labeling (Spotted Arrays) EGFP EGFP KD AAA AAA AAA AAA RNA AAA AAA RT DNA Reverse transcription RNA Enzyme (Superscript RT) Dye Oligo d(T) nucleotides
RNA quality control Pre-labeling quality control:Determine RNA Quality Agilent Bioanalyzer: 50-500 ngNo more formaldehyde gels!! Gel Image (in silico) Sharp, Clear Bands Liver Electropherogram (28S/18S Ratio~2) 6 kb 4 kb 28S 28S 2 kb 18S 1 kb 0.5 kb 0.2 kb Lad, L, P
Microarray Measurements Image Analysis: Spotted arrays Image Analysis Scanner .txt or .xls file
Microarray Measurements Signal: Spotted arrays Spotted microarrays www.molgen.mpg.de cy5 Signal is average of pixel intensities of spot 2 numbers per spot cy3
Image Analysis: Spotted arrays What information do we see? Information: Gene name Oligo id Cy3 intensity Cy5 intensity Steps: Normalize globally Calculate average of cy3 and cy5 Bring cy5 numbers to cy3 by multiplying by common factor Ratios (take ratio of wt/KD…look for 2 fold cutoff) Log2 (calculate log 2 of ratio to differentiate increase or decrease) Reproducibility (how did the four replicates perform?)
Plots 2 fold increase EGFP versus EGFP KD Ratio Log2 2 fold decrease Gene population
Data Analysis Requires software: Spotfire Requires ability to search for Patterns and Trends
mammalian DNA damage response pathway The DNA damage response: putting checkpoints in perspective Bin-Bing S. Zhou* & Stephen J. Elledge² NATURE |VOL 408 | 23 NOVEMBER 2000 |