1 / 0

Campaign Financing and Election Outcome

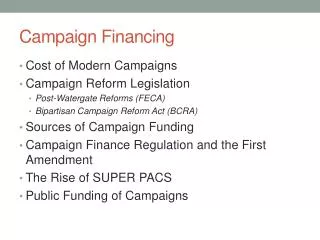
Campaign Financing and Election Outcome. A study of the correlation between fundraising in the U.S. and popular votes in presidential elections . Project Background Brainstorming Federal Election Commission Goals/Objectives Preliminary Comparison Election 2000 and 2004

nickan
Télécharger la présentation

Campaign Financing and Election Outcome

An Image/Link below is provided (as is) to download presentation Download Policy: Content on the Website is provided to you AS IS for your information and personal use and may not be sold / licensed / shared on other websites without getting consent from its author. Content is provided to you AS IS for your information and personal use only. Download presentation by click this link. While downloading, if for some reason you are not able to download a presentation, the publisher may have deleted the file from their server. During download, if you can't get a presentation, the file might be deleted by the publisher.

E N D

Presentation Transcript


  1. Campaign Financing and Election Outcome

    A study of the correlation between fundraising in the U.S. and popular votes in presidential elections
  2. Project Background Brainstorming Federal Election Commission Goals/Objectives Preliminary Comparison Election 2000 and 2004 Relationship Findings Election 2008 Primaries Republican Candidates Democratic Candidates General Election Total Party Contributions Electoral College Conclusions Limitations and Future Work Overview
  3. Background Election 2008 in the media constantly First Presidential Election in 12 years with no previous ties to the White House General Public knowledge about Campaign Financing Federal Election Commission
  4. Federal Election Commission Ensures that candidates and convention committees requesting public funds have satisfied the eligibility requirements. Reviews submitted contributions Audits all public funding recipients to ensure that the funds were spent in compliance with the law
  5. Presidential Candidates and the Federal Election Commission Only candidates seeking nomination by a political party for the office of President are eligible to receive primary matching funds A candidate must establish eligibility by showing broad-based public support: must raise in excess of $5,000 in each of at least 20 states ($100,000). Although an individual may contribute up to $2,300 to a primary candidate, only a maximum of $250 per individual applies toward the $5,000 threshold in each state.
  6. Presidential Candidates must agree to the following: Limit campaign spending for all primary elections to $10 million (plus a cost-of-living adjustment COLA). This is called the national spending limit. Limit campaign spending in each state to $200,000 plus COLA, or to a specified amount based on the number of voting age individuals in the state (plus COLA), whichever is greater. Limit spending from personal funds to $50,000.
  7. Goals Presidential Elections 2000 and 2004 Show relationship between Campaign Contributions and Popular Vote by state Presidential Election 2008 Predict Primary Election using Funds Raised from Quarters 1 and 2 of 2007 Speculate General Election Results
  8. Objectives Inform average voter about the relationship between presidential campaign funding and political race outcome Illustrate a relationship between popular votes and campaign funding
  9. Election 2000
  10. Election 2000
  11. Election 2004
  12. Election 2004
  13. Republican Candidates 2008 Totals Romney: 30,859,721 Giuliani: 30,590,059 McCain: 20,900,595
  14. Democratic Candidates 2008 Totals Clinton: 47,669,977 Obama: 42,953,612 Edwards: 18,213,607
  15. Democratic Primary Outcome Electoral Votes Clinton: 284 Obama: 167 Edwards: 87 Considered candidate that rose the most money in each state the winner The election of delegates to the Democratic National Convention is handled differently in every state – but all consider state population as factor To account for population, we used the number of electoral votes to determine the primary winner
  16. Republican Primary Outcome Electoral Votes Guiliani: 237 Romney: 231 McCain: 70 Considered candidate that rose the most money in each state the winner The election of delegates to the Republican National Convention is handled differently in every state – but all consider state population as factor To account for population, we used the number of electoral votes to determine the primary winner
  17. General Election 2008 Comparison of Republican Candidates vs. Democratic Candidates Funds Raised Totals: Democrats: $108,837,196 Republicans: $82,355,375
  18. General Election Outcome Total Projected Electoral Votes: Democrats (Blue): 358/538 = 67% Republicans (Red): 180/538 = 33%
  19. 2000 – 15 states What about percentage error from past elections? Remember? States where candidates with more campaign contributions didn’t win the popular vote In 2000, the percentage difference by electoral vote is 26% In 2004, the percentage difference by electoral vote is 14% Average is 20% So, assuming +/- 20% error… Democratic electoral votes: 250 – 466 Republican electoral votes: 36 – 288 Votes required to win election: 270 Chance of Clinton victory: 91% Chance of Giuliani victory: 7% Chance of no electoral winner*: 2% 2004 – 8 states * The new House of Representatives votes between the top three candidates to select a president.
  20. Conclusions 2008 Presidential Race Democratic Party nominee: Hillary Clinton Republican Party nominee: Rudy Giuliani Interestingly, neither of these candidates raised the largest amount of money in Q1 and Q2 of 2007 Winning in highly populated states counts! In general election and Republican primary, state winner takes all
  21. Conclusions Population Counts! 2004 Presidential Election Results by State 2004 Presidential Election Results by Population Cartogram Source: http://www-personal.umich.edu/~mejn/election/
  22. Conclusions 44th President of the United States: Hillary Clinton Why? Clinton will win Democratic primary due to support in populous states General election relies heavily on patterns from 2000 and 2004: popular vote in ~80% states went to the candidate whose party raised more money in that state
  23. Limitations Problem: The primary/caucus process varies for each state and party Solution: Study the primary/caucus process for the 2008 election and develop a more complex formula for determining the winner
  24. Limitations Problem: Our study does not consider the impact of 3rd party and Independent candidates on the general election Problem: Our study only includes the three front-runners for each party in primary predictions Solution: Include additional candidates in our study. Ralph Nader won 3% of the popular vote in 2000.
  25. Limitations Problem: Our analysis relies on pattern established by two quarters of fundraising Presidential primaries will take place after four quarters of fundraising General election contributions will also include federal matching funds Solution: Study contributions to 2004 presidential candidates for the first two quarters of 2003
  26. Conclusions Suggestions for similar projects Simplify your problem! Create a map template Study this subject closer to election, if possible
  27. Future Work Our study does not account for contributions and voting at the county level, only the state level. 2004 Presidential Election Results by State 2004 Presidential Election Results by County Source: http://www.princeton.edu/~rvdb/JAVA/election2004/PurpleAmericaPosterAll50.gif
  28. Future Work Revisit this project in early January 2008 Fundraising figures for all four quarters of 2007 Directly before state primaries begin Calculate federal matching funds for Democratic and Republican nominees
  29. Future Work Use this data to plan a campaign trail Campaign staffers decide to plan visits to states where races are very close Our Suggestions: (W) denotes the candidate currently predicted to win Democratic Primary California is very close between Obama and Clinton (W) Iowa is very close between Obama and Edwards (W) Republican Primary Illinois is very close between all candidates. McCain (W) Florida is very close between Romney and Guiliani (W)
  30. Sources Federal Election Commission (FEC) http://www.fec.gov United States Geological Survey (USGS) http://www.usgs.gov Center for Responsive Politics http://www.opensecrets.org Maps and cartograms of the 2004 US presidential election results (University of Michigan) http://www-personal.umich.edu/~mejn/election/ Election 2004 Results http://www.princeton.edu/~rvdb/JAVA/election2004/
  31. Questions?
  32. Calculating Likely Election Winner Clinton For Clinton to lose, number of electoral votes is between 250 and 269. Clinton’s possible number of electoral votes according to analysis is between 250 and 466. Clinton’s chances of losing (269-250)/(466-250) ~ 0.09 (9%) Conversely, Clinton’s changes of winning = 91% Giuliani For Giuliani to win, number of electoral votes is between 270 and 288. Giuliani’s possible number of electoral votes according to analysis is between 36 and 288. Giuliani’s chances of winning = (288-270)/(288-36) ~ 0.07 (7%) Chances of no electoral winner: 100 – Clinton’s chances (91) – Giuliani’s chances (7) = 2%
More Related