Download
1 / 20
200 likes | 370 Vues
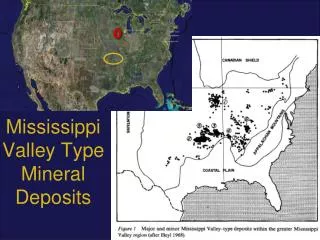
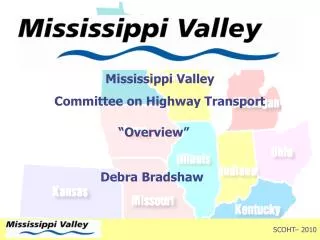
Microsimulation of Commodity Flow in the Mississippi Valley Region. The Microsimulation Team of the Center for Freight Infrastructure Research and Education September 14, 2010. Idea. Descriptive model

E N D
Microsimulation of Commodity Flow in the Mississippi Valley Region The Microsimulation Team of the Center for Freight Infrastructure Research and Education September 14, 2010
Idea • Descriptive model • Exploit multiple freight-related databases that would ordinarily be difficult to link together • Preserve, as much as possible, the richness and detail, both spatial and economic, of the underlying databases • Focus on 5 key indicator commodities • Work mainly at the shipment level • Focus on trucks
Commodities • Chosen from commodities suggested by MVFC states • Greater detail than FAF • Commodities with many origins and destinations in region [SCTG] • Corn [02200] • Soybeans [03400] • Dairy products [all 071xx] • Motor vehicle parts [all 364xx] • Articles of plastics [all 242xx]
Databases • Dun & Bradstreet establishments • Commodity Flow Survey • Census of Agriculture • Agricultural surveys • Crop maps • Benchmark IO table • Freight Analysis Framework • Ontario Commercial Vehicle Survey • Oak Ridge national highway network, enhanced • Others
Major Steps: Crops • Farm synthesis • Crop • Harvested acres • Location (long/lat) • Harvest dates • Planting dates • On-site storage • Truck ownership • Farm shipment generation, by date • Number of shipments • Size • Truck type • Destination type (elevator, ethanol, feed lot, etc.) • Time of Day Most of Cedar County, IA
Major Steps: Crops • Elevator shipment generation • Similar attributes to farm shipments • Destination choice • Shipment distances • Establishment employments, types
Major Steps: Crops • Some simplifying assumptions, e.g., • All farm-based shipments go by truck • All exports from elevators do not go by truck • A single farm has just one crop (corn, soybeans, other) • No transshipment points, except elevators. • Empties are ignored.
Major Steps: Manufactured Products • Shipments move from establishment to establishment, perhaps through a transshipment point. • Actual establishments within the region, “super-establishments” outside region • One super-establishment for each FAF zone for each 6-digit NAICS • Producing establishments limited to those which produce the three indicator industrial commodities • Any establishment can be a consumer. • No households • No empties
Major Steps: Manufactured Products • Shipment generation • Size • Mode • Need one truck? Needs multiple trucks? • Destination • Distance range (CFS) selection • Within range, establishment is selected randomly based on: • Fraction of US employment within 6-digit industrial category • Distance within range • Industry’s share of commodity purchases from IO tables
Major Steps: Manufactured Products • Tour structure selection • P-C • P-W—C • P—W-C • P-C-C • P-W-W-C • P-W—C-C • P—W-C-C • P-C-C-C • Transshipment point selection • Time of day for tour legs P=producer C=consumer W=transshipment point
Route Choice and Traffic Assignment • Sensitive to time of day (“dynamic”) • Link travel times for route choice • FAF zones used only for keeping trips on correct sides of rivers/borders, otherwise no use of TAZs in the assignment step. • Aggregated to nodal catchment areas (about 43,000) • Multiclass • Not capacity restrained • Not a traffic microsimulation
24-Hour Assignment, All Classes, All Commodities, Late October
24-Hour Static Assignment, All Classes, All Commodities, Detail
Traffic Dynamics • Trial simulations underway • One hour intervals • 60 hours of simulated time to allow shipments to arrive from west and east coasts • E.g., 6 am on Monday to 6 pm on Wednesday • Departure times drawn from uniform probability distributions, with logic to keep leg sequences correct given previous leg departure times and trip times. • Need to account for driver rest periods • Need to account for time zones • Very long execution times
Lessons So Far • D&B not perfect but very good, needed considerable help in the agricultural sectors. • High degree of spatial, temporal, economic detail is achievable • Concept is expandable to the full US • Concept could be expanded to most, if not all, commodities • Better representation of the supply chain than found in typical regional models • Simulation times are long but not unreasonable. • Limited applicability to long-term forecasts
The Team • Data management: University of Toledo, Pete Lindquist and staff • Data synthesis: University of Wisconsin—Madison, Jessica Guo and staff • Software development: University of Wisconsin—Milwaukee, Alan Horowitz and staff • Policy: Ernie Wittwer, University of Wisconsin—Madison