Download
1 / 20
200 likes | 352 Vues
Prediction W. Buchmueller (DESY). arXiv:hep-ph/9912317 (1999). Computing. DC track reconstruction Slow control system DRS sampling chip Software framework. Pattern Finding & Track Fitting. Basic Track Fitting done in Pisa MC

E N D
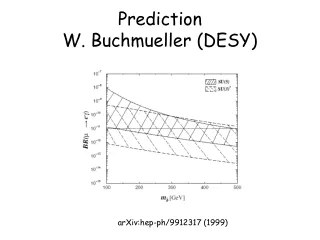
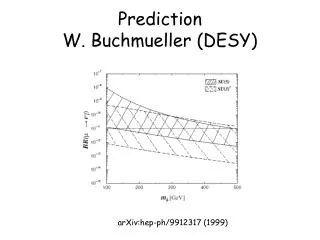
Prediction W. Buchmueller (DESY) arXiv:hep-ph/9912317 (1999)
Computing • DC track reconstruction • Slow control system • DRS sampling chip • Software framework
Pattern Finding & Track Fitting • Basic Track Fitting done in Pisa MC • PSI will concentrate on building the DC and on noise minimization, but not on PF & TF • Interface: f/r/z from waveform analysis done at PSI
Labview control of Large Prototype • MSCB Bus works stable • Hardware in bulk production • Used by 3 other experiments at PSI
Domino Ring Sampler (DRS) Enable In • Free running domino wave, stopped with trigger • Sampling speed 2 GHz (500ps/bin), trigger gate sampling gives 50ps timing resolution • 1024 bins 150ns waveform + 350ns delay • 40 MHz readout
DRS Tests • Sampling Speed 0.7 – 2.5 GHz • Power Supply 35mW (@2.5V), 6mW (@1.8V) • Timing jitter: 100ps • Readout stable at 40 MHz • TC: 0.2% / deg. C
Test Pulse Readout 12ns Input pulses Limited by readout cirquitry!
Domino Wave Stabilization Phase and Frequency Stabilization Trigger Signal Sampling domino wave FADC 8 inputs DLL Vspeed External Common Reference Clock shift register trigger gate MUX
Schedule July 2002: 2001 2002 2003 2004 1st Prototype 2nd Prototype Boards 1st Prototype Tests 2nd Prototype Boards Jan 2003: Design Manufactoring Assembly Test Milestone
HOWTO Questions (A. Blondel) • Process MC events through analysis chain • Handle calibration constants, bookkeeping and monitoring • Visualize single events • “Harmonize” software, have same framework in Japan, Italy and PSI • Description of current software (beam tests) • Organization to develop software • Data processing capabilities
Analyzing MC Data MIDAS structure Online data online Logger Data File Shared memory MC Waveform Frontend Analyzer Shared memory PAW Pedestal Subtraction offline Calibration MC PMT Data File Analyzer N-tuple File PAW Energy Summing Histogram Display PAW/Root MC particles “Staged” MIDAS analyzer Physics Cuts Single Event Display Histograms storage
Online Database Online Logger Frontend ODB Calibration constants, SW+HW Configuration Frontend Frontend Analyzer Run1 Run2 Run3 Run4 CalibA CalibB CalibC Offline ODB Calibration constants, SW+HW Configuration Data file Analyzer
Monitoring • MIDAS History • Trendlines over time • Slow control (temperatures, pressures, etc.) • Scaler ratios • Efficiencies • “Physics” rates
Alarm System • Integrated into MIDAS DAQ • Slow control variables and analyzer variables • Connected to pager system
Software organization • Analyzer contains “common” and “private” modules • Three “software managers” (Japan, Italy, PSI) maintain software locally and decide about common modules • Algorithms are developed inside MC and converted to analyzer modules • Revision management with CVS • MC upgrade: Pisa? • Single event display: small task for one person
Processing capabilities • Assume: 100 Hz trigger, 50% occupancy (LXe) and 10% occupancy (DC) • Data: 1.2MB/event or 120MB/sec • Online Linux cluster: each node <10MB/sec • 3rd level trigger: waveforms only for meg candidates stored, else ADC/TDC analysis (10kB/event) • Waveform compression: 10x • 90Hz ADC/TDC data, 10Hz waveform data10 x 1.2MB x 0.1 + 90 x 0.01MB = 2.1 MB
Existing Online DAQ system History system Alarm system Electronic logbook Analyzer framework PAW histogram display Used in Japan, PSI, Pisa Elaborate MC Required Single Event Display (1-2 PM) MC interface to DAQ (1 PW) MC “upgrade” (noise, inefficiencies, pileup) Track reconstruction Analyzer modules Software Framework Summary