Download

1 / 20
200 likes | 377 Vues
Structure and Variability of Middle Atlantic Bight Hydrography Charles Flagg and Alexandra Sanchez-Franks New York Marine Sciences Consortium Symposium September 22, 2012. The Oleander Project. Hudson River Plume in the New York Bight Apex

E N D
Structure and Variability of Middle Atlantic Bight Hydrography Charles Flagg and Alexandra Sanchez-Franks New York Marine Sciences Consortium Symposium September 22, 2012 The Oleander Project
Hudson River Plume in the New York Bight Apex Model results under high discharge conditions and variable wind directions Salinity Surface velocity vectors and surface salinity shown Choi and Wilkin, JPO, 2007
Summer stratified shelf and remnant winter water in cold pool Winter vertically mixed shelf waters Seasonal Themocline Temperature Cold Pool Shelfbreak Front 34.5 psu Salinity Shelfbreak Front Shelfbreak Front Aikman, JGR, 1984
SEEP-I Temperature/Salinity Diagrams Winter Summer Warm/Saline Gulf Stream influenced waters Shelfbreak Cold pool Deep Slope Sea waters Castalao, et al, JGR, 2010
Observed Currents (and winds) in the Middle Atlantic Bight Lentz, JPO, 2008
Where do the shelf waters come from? Hypothesis 1 Based on salinity and 18O2 Hypothesis 2 Based on coincidence of shelf and slope interannual variations Chapman and Beardsley, JPO, 1989
Velocity to 800m is measured with an Acoustic Doppler Current Profiler, temperatures to 750 m with XBTs, and surface salinity using a thermo-salinograph.
Long-term (1992-2002) mean alongshore velocity along the Oleander transect Inshore branch of the slope sea gyre Shelfbreak Jet m/s
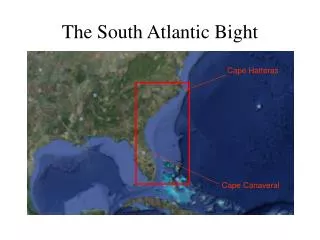
NOAA/NMFSC and Oleander Project XBT Transect Shelf Slope Sea Sargaso
Surface temperatures along the Oleander’s track from New York to Bermuda New York < Shelf Break < Gulf Stream’s North Wall Along Track Latitude Sargaso Sea Bermuda
Surface temperatures along the Oleander’s track from New York to Bermuda New York < Shelf Break < Gulf Stream’s North Wall Along Track Latitude Sargaso Sea Bermuda 15oC at 200m Position anomaly
North Atlantic Oscillation Negative Phase Positive Phase
Long-term Sealevel Change – related to slowing of the Gulf Stream? Sallenger et al, Nature, 2012
Two decades of transport estimates from the Oleander Project While interannual fluctuations occur, a few percent, there is no statistically significant trend.
Nevertheless, there are long-term changes occurring in the hydrography of the Middle Atlantic Bight and this is having a clear impact on the northward movement of various fish species Average bottom temperatures from NEFSC ground fish surveys, (Richardson et al., 2010) 1977-94; 1995-08; and Bottom Temperature Changes
Summary • The Middle Atlantic Bight hydrography is the result of the interplay of processes that operate over a wide range of space and time scales • Fresh Water inputs from local and remote rivers • Seasonal heating and cooling • Remote source waters extending all the way to Greenland • Exchange of waters across the shelfbreak front mediated by inflow from the Labrador Sea concommitment N-S movement of the Gulf Stream • Long term climatic warming