Download
1 / 27
280 likes | 394 Vues
The Value of Reflective Wall Coatings. André Desjarlais Oak Ridge National Laboratory 17 February 2011. Presentation summary. Is energy efficiency in buildings and walls important? Some statistics…… What research is going on to measure energy benefits of “Cool” walls?

E N D
The Value of Reflective Wall Coatings André Desjarlais Oak Ridge National Laboratory 17 February 2011
Presentation summary • Is energy efficiency in buildings and walls important? Some statistics…… • What research is going on to measure energy benefits of “Cool” walls? • What are the energy savings of this technology?
Energy is the defining challenge of our time The major driver for Climate change National security Economic competitiveness Quality of life Incremental changes to existing technologies cannot meet this challenge Transformational advancesin energy technologiesare needed Critically dependent on the best science and technology Global energy consumptionwill increase 50% by 2030 3 Managed by UT-Battellefor the Department of Energy
North American countries can improve their efficiency Norway Sweden United States Canada Italy Japan Czech Republic Russia Chile China Source: Energy Information Administration and United Nations Statistics Division
Improvements in energy efficiency of the economy have been essential to the stabilization of U.S. energy consumption . . Estimated energy savings Non-hydro renewables Quadrillion Btu Nuclear Natural gas Hydro Petroleum Wood Coal Source: Energy Information Administration, U.S. Bureau of Economic Analysis
Buildings energy use is large and growing Buildings Drive Electricity Supply Investment 73% of U.S. Electricity Source: EIA Annual Energy Review, Table 8.9, June 2007 Buildings Energy Use Growing Fastest 34% of Natural Gas Directly (55% Incl. Gen) 40% of U.S. Primary Energy Consumption (39% of U.S. Carbon Emissions) Industry 377 MMTC (25%) Buildings 658 MMTC (43%) Source: 2007 Buildings Energy Data Book. Tables 1.1.3, 1.2.3, 1.3.3
The building envelope is the key!! Has Impact on 57% of Existing Loads ▪ $133 Billion Annually ▪ 13.9% of U.S. Energy ▪ 3.5% of Global Energy • 133 Billion $/yr • 13.9% US Energy • 3.5% Global Energy
Quiz With Comfort and Energy Efficiency in mind, which car do you select to drive during the summer?
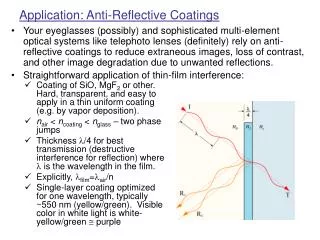
Critical properties Reflectance(rsolar) Emittance(eIR)
rsolarandeIRare both very important! Total Solar Irradiation Convection Net Infrared Radiation hair(tair-ts) It rsolarIt Reflected eIRDR with DR=s(Ts4-Tsurr4 ) (asolarItAbsorbed) Net Heat Flux into Building
Camouflage invisible to night vision Near Infrared Film Conventional Film
Higher reflectance without sacrificing color choice Regal White Rawhide Slate Blue Standard SR .67 Cool SR .72 Standard SR .47 Cool SR .56 Standard SR .21 Cool SR .33 Slate Bronze Brick Red Charcoal Gray Hartford Green Standard SR .08 Cool SR .26 Standard SR .14 Cool SR .28 Standard SR .11 Cool SR .28 Standard SR .25 Cool SR .30
Overview: scope of work • Compare thermal performance of walls with cool (high infrared reflectance) and standard colors
ORNL test site • IR coating on right stud space and upper half of middle; Non-IR coating on rest except for strip of uncoated primer at bottom
ORNL test site • Data acquisition continuous for three years • Check consistency of data with program to estimate wall properties from temperature and heat flux measurements. Data very consistent from month to month • Behavior of solar radiation control on vertical walls more complicated than low-slope roofs. Difficult to generalize simply
ORNL test site: Non vs IR -- summer day Non Outside Wall Solar Non Inside Non Heat Flux IR Outside IR Heat Flux IR Inside Air Heat Flux, 2 Solar/100 1 Temper- ature (°F) [Btu/(h·ft²)] 0 • Air temp warmer but wall solar lower vs 4/16/05 • Behavior of Non and IR again same at night • Peak temps again consistent with coatings over primer -1 130 110 -2 90 70 50 30 24 0 4 8 12 16 20 Hours into July 25, 2005
Model for wall behavior • Seek a model that can be generalized to give results for whole buildings • Have done extensive validation of a model in DOE 2.2 for a 1100 ft² ranch house Conventional Wood-Framed Construction • Heat/cool with heat pump: 68°F winter; 76°F summer; size heat pump for climate • Occupy with 3 people + Building America energy use profiles
Model for wall behavior • To validate model, generate climatic data from ORNL weather station records for year of test • Use properties of wall materials along with construction details for test section Texcote coatings with different solar reflectance Fiberglass batt (R-11) Measured temperatures Gypsum wallboard Stucco (1 in.) Measured heat flux Non-vented air space Extra gypsum layer (only for validation) Oriented strand board
Model generalizations • Building America Performance Analysis Resources at http://www.eere.energy.gov/buildings/building_america/pa_resources.html gives energy use profiles for three occupants (3 BR home). Choose to heat and cool with air-to-air heat pump (76°F cooling; 68°F heating; no setup or setback) • Choose seven different climates to show response of typical house to cooling and mixed climates of interest 4500 CDD65 (°F-day) 4000 HDD65 (°F-day) 3500 Average Daily Solar (Btu/ft²) 3000 2500 • Cities arranged by decreasing cooling degree days 2000 1500 1000 500 0 Miami Phoenix Richmond Knoxville Las Vegas Sacramento Bakersfield
Model generalizations • IR reflective coating on conventional walls saves cooling energy. Savings are 4% to 9% compared to non-IR reflecting walls 6000 Annual Electricity for Cooling (kWh) Walls: Wood Studs + R-11 Batts 4.2 Non Walls 5000 5.0 IR Walls 4000 % Savings for IR Walls 5.3 3000 6.2 2000 7.6 7.1 9.0 1000 0 Miami Phoenix Knoxville Richmond Las Vegas Bakersfield Sacramento
Model generalizations • IR reflective coating on CMU walls shows larger savings of cooling energy. Savings are 6% to 13% compared to cooling energy with non-IR reflecting walls 6000 Annual Electricity for Cooling (kWh) Walls: 8 in. CMU + R-5 Foam 6.4 6.9 Non Walls 5000 IR Walls 4000 % Savings for IR Walls 6.7 3000 8.6 2000 11.0 10.4 13.0 1000 0 Miami Phoenix Knoxville Richmond Las Vegas Bakersfield Sacramento
Project summary • Full year of ORNL data validated DOE 2.2 model • Complexity of real wall applications (different orientations, shading and construction) makes generalization very difficult • DOE 2.2 whole building annual energy estimates for ranch house show that IR reflecting pigments save 4% to 13% of cooling energy
The Value of Reflective Wall Coatings Questions or comments?