Download

1 / 11
130 likes | 338 Vues
Gross Domestic Product. Gross Domestic Product. Gross domestic product , or GDP, measures the value of all final goods and services produced in the economy. It does not include the value of intermediate goods.

E N D
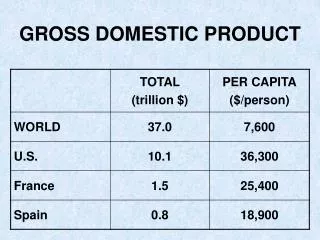
Gross Domestic Product • Gross domestic product , or GDP, measures the value of all final goods and services produced in the economy. It does not include the value of intermediate goods. • GDP is used as a measure of the size of an economy and can also be used to compare the economic performance in other countries. • In 2004, the GDP of the U.S. was $11,734 billion (Erbi)
Gross Domestic Product • Aggregate spending, the sum of consumer spending, investment spending, government purchases, and exports minus imports, is the total spending on domestically produced final goods and services in the economy. • Aggregate Spending GDP = C + IG + G + XN C = Consumption IG = Gross Private Investment G = Government Spending XN= Net Exports = Exports (X) – Imports (IM or M) (Erbi)
GDP: WHAT’S IN AND WHAT’S OUT Included • Domestically produced final goods and services (including capital goods) • New construction of structures • Changes to inventories Not Included • Intermediate goods and services • Inputs • Used goods • Financial assets like stocks and bonds • Foreign-produced goods and services • Underground or ‘black market’ activity is not counted. (Erbi)
Real GDP and Aggregate Output Real GDP is the market value of all final goods and services produced inside a country’s border during a period of time. • In layman’s term it measures the total output of an economy. • An increase in Real GDP indicates an increase in jobs, and an increase in goods and services available for consumption. • A decrease in Real GDP indicates a recession or depression. (Erbi)
Households • “To figure a country’s Real GDP, a country can add up all of the components that make up the Product Market on the right side of the Circular Flow.” (Brunelle) Resource Market Govern-ment Product Market Firms
Flow of Expenditures Households Consumption + Investment + Government Govern-ment Product Market + Net Exports M X = Real GDP Firms • “When these are all added together—Consumption (households) + Investment (firms) + Government + Net Exports = Real GDP” (Brunelle) • “Add up the value of Net Exports in the Product Market.” (Brunelle) • “When you add up all of the components of the Product Market to get Real GDP, this called the “Flow of Expenditures.” (Brunelle) • “Add up all of the Government expenditures in the Product Market.” (Brunelle) • “Add up all of the Consumption by households in the Product Market.” (Brunelle) • “Add up all of the Investment by households in the Product Market.” (Brunelle)
Flow of Expenditures Households Consumption $ 8,742 + Investment $ 2,057 Govern-ment Product Market + Government $ 2,373 + Net Exports -$ 717 Firms = Real GDP $ 12,456 “The 2005 figures for the United States’ Flow of Expenditures shown in billions of dollars (Consumption, Investment, Government, andNet Exports) are as follows:” “The Real GDP for the United States in 2005 was…. $12,456,000,000,000 ($12,456 Trillion dollars.” (Brunelle)
2005 United States ($ billions) Real Gross Domestic Product12,456 Plus Foreign Income Adjustment 32 Equals Real Gross National Product12,456 Less Depreciation 1,605 Equals Net National Product10,883 Less statistical discrepancy 71 Equals Net National Income 10,812 Less corporate profits 1,331 Less indirect taxes 865 Less social insurance contributions 881 Less net interest 483 Less business current transfer payments 74 Less surplus of government enterprises -15 Plus personal income receipts on assets 1,519 Plus personal current transfer receipts 1,527 Equals Personal Income 10,239 Less personal taxes 1,203 Equals Disposable Income 9,036 Let’s look at the left side of the circular flow. Flow of Earnings/Income Households M Resource Market Govern-ment X Firms “When you add and subtract all of the components of Real GDP on this side of the circular flow, you get the same Real GDP for 2005, $12,456,000,000,000.” “The left side of the circular flow (Resource Market) is the Flow of Earnings/Income in the National Accounting.” (Brunelle)
Flow of Earnings/Income • Real GDP = C + I + G + (X – M) • Foreign Income Adjustment = the income payments to households, firms, & governments outside of the United States are subtracted from income that U.S. entities earn from outside the U.S. • Personal Income = is the flow back into Households • Deducting personal income taxes from Personal Income gives us the Disposable Income of households. (Used for either consumption or savings.) (Erbi)
Works Cited • Brunelle, Dick and Steven Reff. National Accounting also known as Flow of expenditures/Flow or Earnings/Income. Reffonomics. 2006. 10 Feb. 2008. http://www.reffonomics.com/TRB/NationalAccountin g/nationalaccounting3.swf • Erbil, Can“MacroEconomics. ”Worth Publishers.. 2005.