Download
1 / 68
680 likes | 843 Vues
Digging into Census Data to Find Good Stories. Sean Lahman – SLAHMAN@gannett.com Rochester Democrat & Chronicle SeanLahman.com/resources. Digging for Stories. Computer Assisted Reporting.

E N D
Digging into Census Data to Find Good Stories Sean Lahman – SLAHMAN@gannett.comRochester Democrat & Chronicle SeanLahman.com/resources
Computer Assisted Reporting “Journalists need to be data-savvy. It used to be that you would get stories by chatting to people in bars, and it still might be that you'll do it that way some times. But now it's also going to be about poring over data and equipping yourself with the tools to analyse it and picking out what's interesting.” London, November 2010 Tim Berners-Lee Inventor of the World Wide Web
Since 1790 Representatives and direct Taxes shall be apportioned among the several States which may be included within this Union, according to their respective Numbers…
10 Questions in 10 Minutes • How many people live here? • Age, gender, race of each • Home ownership?
Data Release Schedule • Dec 2010 Totals for all states • February & March - Redistricting data for each state • May – Demographic profiles • June-August – Summary File 1 • Late 2011 / early 2012 – Summary File 2
Shortest. Census. Form. Ever. The more questions the Census Bureau asked, the fewer responses they received.
American Community Survey • Samples roughly 3 million people per year • 1-year, 3-year, and5-year data released • 65,000 & 20,000 population sizes
“Census data” is really many data sets • Decennial Census • American Community Survey • Small Area Income and Poverty Estimates • American Housing Survey • Consumer Expenditure Survey • Public Use Microdata Samples • Survey of Construction • … and more
Levels of Complexity • Age • Gender • Race • Location
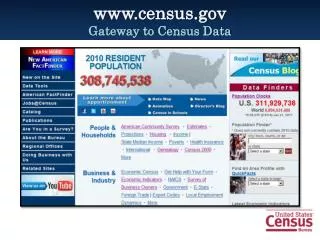
Getting the Data http://www2.census.gov/census_2010/
DataFerrett http://thedataweb.org/ or http://dataferrett.census.gov
Other Resources • New York State Data Centerhttp://esd.ny.gov/ • Lewis Mumford Center - University of Albany http://www.albany.edu/mumford/ • University of Virginia http://mapserver.lib.virginia.edu/ • NYC Department of City Planninghttp://gis.nyc.gov/dcp/pa/address.jsp • University of Michiganhttp://www.icpsr.umich.edu/icpsrweb/ICPSR/ • University of Minnesota (PUMS)http://usa.ipums.org/usa/
Finding Story Ideas "People don't really tell you this, but often the amount of time you spend finding a decent story is more than the time it takes to produce the story.“ -- Ira Glass
Civics for Journalists • Who is your audience? • Context • Need reliable numbers other than the Census Bureau
Redistricting • Redistricting is an intensely political process • There is a vocabulary to redistricting • Section 5 • Gerrymandering • Huge opportunity to share historical info with readers • Communities of Interest
Population • Urban sprawl, neighborhood decay, suburban flight • Population density maps • Growth/decline of population in neighborhoods • Average household size (changes, comparisons between neighborhoods)
Age and Gender • (More detailed age breakdowns available in May) • Graying or seeing a baby boom? • Concentrations of older residents vs. children • Gender differences in neighborhoods • Generational conflicts (mixing of generations)
Race and Ethnicity • (Top level race data in first release, more detail in summer release) • Look at race breakdowns by age (growth of minority population tends to be bottom up) • Surge in Hispanic population is a national story (14 to 35 million from 1980-2000) • Segregation & diversity (see the Mumford Center at SUNY Albany, or USAT diversity index)
Relationships • Types of households (available in may) • Seniors living alone • Grandchildren living in household • Consider mapping same-sex couples, single mothers
Housing • Vacant housing units: what is the trend, and where? • Owner-occupied vs. rentals • How many people own their homes free and clear? Where are they? • Foreclosures… where and how many?
Other Ideas • Redistricting on the local level • Compare racial composition of school population with citizens 18+ (voters) • New ACS variables: healthcare coverage, degree field, Veterans’ disability, marital history • Housing double-up as an indicator of economic impact
New York Ideas • Look at the extent to which the recession, mortgage meltdown slowed the migration away from NY. • NY an example of state that is aging, but also seeing a decline in child population (<18) 2000-10 • Also look at: % Children w/immigrant parents, children speaking other than English, HS dropout rates for 1st generation vs. 2nd generation Hispanics • To what extent does # of seats impact fed $ compared to seniority of your reps (and which committees they are on)
Demographic Resources • Our Patchwork Nation – Dante ChinniIdentified clusters based on income, education, population growth, unemployment, foreclosure rates, Starbucks vs. Wal-Mart • Who We Are Now – Sam Roberts • The Big Sort – Bill Bishop • A Field Guide to Sprawl – Dolores Hayden
Shan Carter Data Visualization “The last thing the internet needs is more data.” Shan Carter, Interactive Graphics EditorThe New York Times