Download
1 / 11
110 likes | 216 Vues
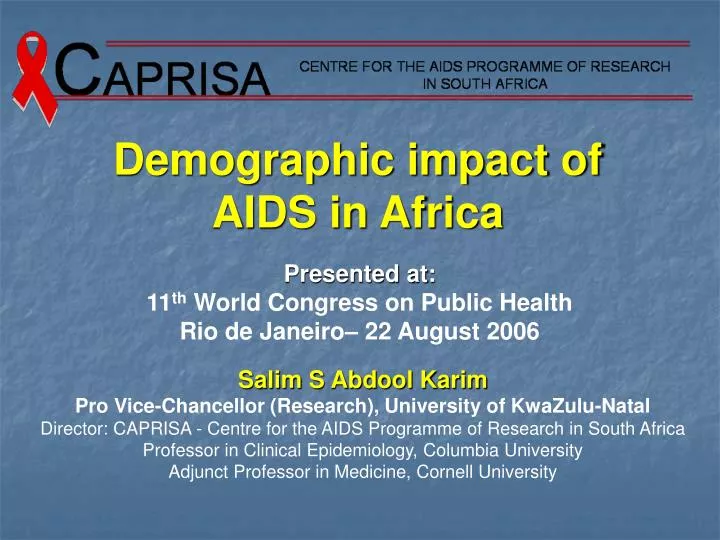
Demographic impact of AIDS in Africa. Presented at: 11 th World Congress on Public Health Rio de Janeiro– 22 August 2006. Salim S Abdool Karim Pro Vice-Chancellor (Research), University of KwaZulu-Natal Director: CAPRISA - Centre for the AIDS Programme of Research in South Africa

E N D
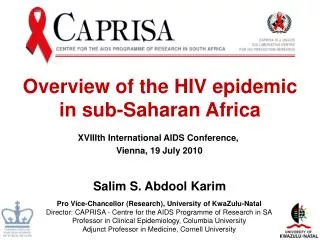
Demographic impact of AIDS in Africa Presented at: 11th World Congress on Public Health Rio de Janeiro– 22 August 2006 Salim S Abdool Karim Pro Vice-Chancellor (Research), University of KwaZulu-Natal Director: CAPRISA - Centre for the AIDS Programme of Research in South Africa Professor in Clinical Epidemiology, Columbia University Adjunct Professor in Medicine, Cornell University
CAPRISA Scale of global HIV epidemic - 2004 *(conservative estimate) Source: Joint UNAIDS and WHO AIDS epidemic update December 2004
CAPRISA The evolving HIV epidemic in Africa Morocco Algeria Western Sahara Libya Egypt Mauritania Mali Niger Senegal Benin Chad Burkina Faso Ghana Sudan Guinea Guinea Bissau Nigeria Sierra Leone Somalia Ethiopia Central Afr Rep Liberia Togo Cameroon Cote D’Ivoire Congo Uganda Kenya Gabon Zaire Tanzania Data unavailable Angola 0 - 0.99% Malawi Zambia Mozambique 1 - 4.9% Zimbabwe Namibia Botswana 5 - 9.9% South Africa Swaziland 10 - 19.9% Lesotho ≥20% 1984 1994 2003 Source: adapted from Abdool Karim SS. The African Experience. In: Kenneth Mayer and HF Pizer (eds) The AIDS Pandemic: Impact on science and society. 2005
39.0 HIV/AIDS 7.5 Homicide/violence 4.3 Tuberculosis 4.2 Diarrhoeal disease (% years of life lost) 4.1 Road traffic accidents 3.9 Lower respiratory infections 2.7 Stroke 2.5 Ischaemic heart disease CAPRISA 1.7 Low birth weight 1.5 Protein-energy malnutrition Impact of HIV/AIDS on mortality in South Africa - 2000 Source: Bradshaw et al. South African Medical Journal 2005; 95: 496-503
Impact of AIDS in South Africa: Mortality in Men 350 300 250 200 PERCENTAGE OF 1985-1990 AVERAGE 150 100 50 0 15-19 20-24 25-29 30-34 35-39 40-44 45-49 50-54 55-59 60-64 65-69 1996-1998 1999-2000 AGE Source: Dorrington R, Bourne D, Bradshaw D, Laubscher R, Timæus IM. The Impact of HIV/AIDS on Adult Mortality in South Africa. MRC Technical Report. 2001
Impact of AIDS in South Africa: Mortality in Women 3.5 3.0 2.5 1994 1996 2.0 1997/8 Ratio 1998/99 1.5 1999/2000 1.0 0.5 0.0 15-19 20-24 25-29 30-34 35-39 40-44 45-49 50-54 55-59 60-64 Age Source: Dorrington R, Bourne D, Bradshaw D, Laubscher R, Timæus IM. The Impact of HIV/AIDS on Adult Mortality in South Africa. MRC Technical Report. 2001
Impact of Antiretroviral Treatment on mortality in the USA CAPRISA 45 40 35 30 25 20 15 10 5 0 Unintentional injury Cancer Deaths per 100,000 population Heart Disease Suicide HIV infection Homicide Stroke 87 88 89 90 91 92 93 94 95 96 97 98 99 00 Year Trends in annual rates of death due to leading causes of death among persons 25-44 years, USA, 1987-2000 Source: Adapted from lecture series by the University of South Carolina School of Medicine: http://pathmicro.med.sc.edu/lecture/hiv-USfigs.htm
CAPRISA HIV Infection scenarios of the impact of ART in South Africa 40 Scenario B 30 Scenario A HIV prevalence (%) 20 Scenario C 10 0 1988 1990 1992 1994 1996 1998 2000 2002 2004 2006 2008 Year Actual HIV prevalence rates in South African pregnant women Projection scenarios. Scenario A = No ART ScenarioB = ART without improvements in prevention, and ScenarioC = ART accompanied by improved prevention Source: Abdool Karim SS, Abdool Karim Q, Baxter C. Lancet 2003; 362: 1499.
Treatment and Prevention scenarios 4 3 2 1 0 Number of people (millions) HIV infections Averted AIDS deaths averted Treatment and prevention scenario Prevention only scenario CAPRISA Johnson/Dorrington simulation model: Impact of ART on prevention and mortality Projected HIV infections and AIDS deaths averted, 2002 to 2015 Source: Johnson and Dorrington, 2002
New HIV infections (millions) 40 30 20 10 Baseline Treatment-centred (mixed) Prevention centred Combined response (optimistic) CAPRISA Solomon simulation model: Impact of ART on new HIV infections HIV incidence in sub-Saharan Africa, 2003-2020: various intervention scenarios Source: Solomon et al. PLOS Medicine 2005; 2(1): 50-6.
CAPRISA Conclusion • AIDS is one of the global public health community’s greatest challenges • The demographic impact: • Deaths of children & young adults • Higher mortality in women than men • Orphan and vulnerable children • Negative impact on dependency ratio • AIDS prevention and treatment can alter the future course of the epidemic