Download
1 / 1
10 likes | 110 Vues
Meghan E. Morean 1 , William R. Corbin 2 , and Teresa A. Treat 3 Yale School of Medicine, Department of Psychiatry 1 Arizona State University, Department of Psychology 2 University of Iowa, Department of Psychology 3. Introduction. Background Rationale

E N D
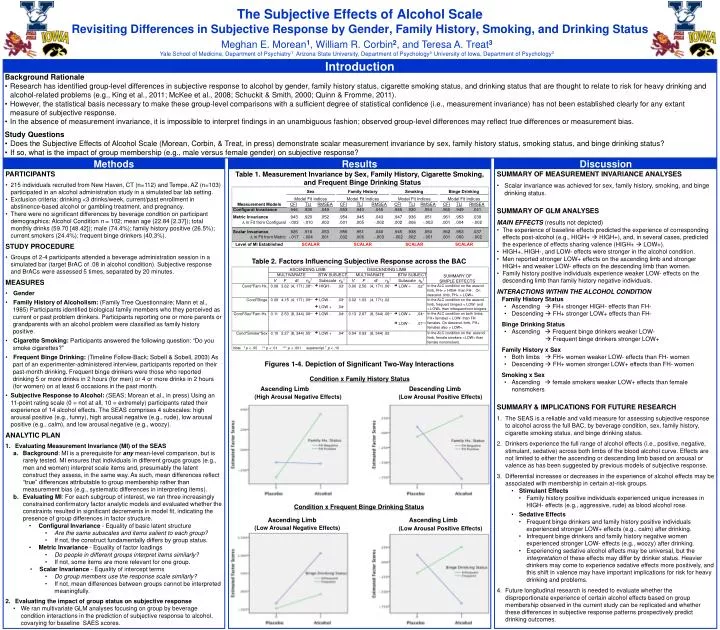
Meghan E. Morean1, William R. Corbin2, and Teresa A. Treat3 Yale School of Medicine, Department of Psychiatry1 Arizona State University, Department of Psychology2 University of Iowa, Department of Psychology3 Introduction • Background Rationale • Research has identified group-level differences in subjective response to alcohol by gender, family history status, cigarette smoking status, and drinking status that are thought to relate to risk for heavy drinking and alcohol-related problems (e.g., King et al., 2011; McKee et al., 2008; Schuckit & Smith, 2000; Quinn & Fromme, 2011). • However, the statistical basis necessary to make these group-level comparisons with a sufficient degree of statistical confidence (i.e., measurement invariance) has not been established clearly for any extant measure of subjective response. • In the absence of measurement invariance, it is impossible to interpret findings in an unambiguous fashion; observed group-level differences may reflect true differences or measurement bias. • Study Questions • Does the Subjective Effects of Alcohol Scale (Morean, Corbin, & Treat, in press) demonstrate scalar measurement invariance by sex, family history status, smoking status, and binge drinking status? • If so, what is the impact of group membership (e.g., male versus female gender) on subjective response? Methods Results Discussion • PARTICIPANTS • 215 individuals recruited from New Haven, CT (n=112) and Tempe, AZ (n=103) participated in an alcohol administration study in a simulated bar lab setting. • Exclusion criteria: drinking <3 drinks/week, current/past enrollment in abstinence-based alcohol or gambling treatment, and pregnancy. • There were no significant differences by beverage condition on participant demographics: Alcohol Condition n = 102; mean age (22.84 [2.37]); total monthly drinks (59.70 [48.42]); male (74.4%); family history positive (26.5%); current smokers (24.4%); frequent binge drinkers (40.3%). • STUDY PROCEDURE • Groups of 2-4 participants attended a beverage administration session in a simulated bar (target BrAC of .08 in alcohol condition). Subjective response and BrACs were assessed 5 times, separated by 20 minutes. • MEASURES • Gender • Family History of Alcoholism: (Family Tree Questionnaire; Mann et al., 1985) Participants identified biological family members who they perceived as current or past problem drinkers. Participants reporting one or more parents or grandparents with an alcohol problem were classified as family history positive. • Cigarette Smoking: Participants answered the following question: “Do you smoke cigarettes?” • Frequent Binge Drinking: (Timeline Follow-Back; Sobell & Sobell, 2003) As part of an experimenter-administered interview, participants reported on their past-month drinking. Frequent binge drinkers were those who reported drinking 5 or more drinks in 2 hours (for men) or 4 or more drinks in 2 hours (for women) on at least 6 occasions in the past month. • Subjective Response to Alcohol: (SEAS; Morean et al., in press) Using an 11-point rating scale (0 = not at all, 10 = extremely) participants rated their experience of 14 alcohol effects. The SEAS comprises 4 subscales: high arousal positive (e.g., funny), high arousal negative (e.g., rude), low arousal positive (e.g., calm), and low arousal negative (e.g., woozy). • ANALYTIC PLAN • Evaluating Measurement Invariance (MI) of the SEAS • Background: MI is a prerequisite for any mean-level comparison, but is rarely tested. MI ensures that individuals in different groups groups (e.g., men and women) interpret scale items and, presumably the latent construct they assess, in the same way. As such, mean differences reflect “true” differences attributable to group membership rather than measurement bias (e.g., systematic differences in interpreting items). • Evaluating MI: For each subgroup of interest, we ran three increasingly constrained confirmatory factor analytic models and evaluated whether the constraints resulted in significant decrements in model fit, indicating the presence of group differences in factor structure. • Configural Invariance - Equality of basic latent structure • Are the same subscales and items salient to each group? • If not, the construct fundamentally differs by group status. • Metric Invariance - Equality of factor loadings • Do people in different groups interpret items similarly? • If not, some items are more relevant for one group. • Scalar Invariance - Equality of intercept terms • Do group members use the response scale similarly? • If not, mean differences between groups cannot be interpreted meaningfully. • Evaluating the impact of group status on subjective response • We ran multivariate GLM analyses focusing on group by beverage condition interactions in the prediction of subjective response to alcohol, covarying for baseline SAES scores. Table 1. Measurement Invariance by Sex, Family History, Cigarette Smoking, and Frequent Binge Drinking Status • SUMMARY OF MEASUREMENT INVARIANCE ANALYSES • Scalar invariance was achieved for sex, family history, smoking, and binge drinking status. • SUMMARY OF GLM ANALYSES • MAIN EFFECTS(results not depicted) • The experience of baseline effects predicted the experience of corresponding effects post-alcohol (e.g., HIGH+ HIGH+), and, in several cases, predicted the experience of effects sharing valence (HIGH+ LOW+). • HIGH+, HIGH-, and LOW- effects were stronger in the alcohol condition. • Men reported stronger LOW+ effects on the ascending limb and stronger HIGH+ and weaker LOW- effects on the descending limb than women. • Family history positive individuals experience weaker LOW- effects on the descending limb than family history negative individuals. • INTERACTIONS WITHIN THE ALCOHOL CONDITION • Family History Status • Ascending FH+ stronger HIGH- effects than FH- • Descending FH+ stronger LOW+ effects than FH- • Binge Drinking Status • AscendingFrequent binge drinkers weaker LOW- • Frequent binge drinkers stronger LOW+ • Family History x Sex • Both limbs FH+ women weaker LOW- effects than FH- women • Descending FH+ women stronger LOW+ effects than FH- women • Smoking x Sex • Ascending female smokers weaker LOW+ effects than female nonsmokers • SUMMARY & IMPLICATIONS FOR FUTURE RESEARCH • The SEAS is a reliable and valid measure for assessing subjective response to alcohol across the full BAC, by beverage condition, sex, family history, cigarette smoking status, and binge drinking status. • Drinkers experience the full range of alcohol effects (i.e., positive, negative, stimulant, sedative) across both limbs of the blood alcohol curve. Effects are not limited to either the ascending or descending limb based on arousal or valence as has been suggested by previous models of subjective response. • Differential increases or decreases in the experience of alcohol effects may be associated with membership in certain at-risk groups. • Stimulant Effects • Family history positive individuals experienced unique increases in HIGH- effects (e.g., aggressive, rude) as blood alcohol rose. • Sedative Effects • Frequent binge drinkers and family history positive individuals experienced stronger LOW+ effects (e.g., calm) after drinking. • Infrequent binge drinkers and family history negative women experienced stronger LOW- effects (e.g., woozy) after drinking. • Experiencing sedative alcohol effects may be universal, but the interpretation of these effects may differ by drinker status. Heavier drinkers may come to experience sedative effects more positively, and this shift in valence may have important implications for risk for heavy drinking and problems. • Future longitudinal research is needed to evaluate whether the disproportionate experience of certain alcohol effects based on group membership observed in the current study can be replicated and whether these differences in subjective response patterns prospectively predict drinking outcomes. The Subjective Effects of Alcohol ScaleRevisiting Differences in Subjective Response by Gender, Family History, Smoking, and Drinking Status Table 2. Factors Influencing Subjective Response across the BAC Figures 1-4. Depiction of Significant Two-Way Interactions Condition x Family History Status Ascending Limb Descending Limb (High Arousal Negative Effects) (Low Arousal Positive Effects) Condition x Frequent Binge Drinking Status Ascending Limb Ascending Limb (Low Arousal Negative Effects) (Low Arousal Positive Effects)