Download
1 / 18
180 likes | 267 Vues
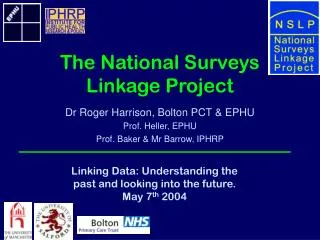
This project, conducted in 2004, aimed to link & understand existing health surveys post-1989, providing insights for future interventions and policy-making. Despite 53 identified surveys, data remained siloed, limiting analysis possibilities. Survey content similarities allowed comparison, but missed opportunities for in-depth analyses due to lack of storage and linkage capabilities. Overcoming these challenges could lead to improved service provision, better understanding of health factors, and influence policy decisions. Feasibility of area-level data linkage highlighted for impactful research outcomes.

E N D
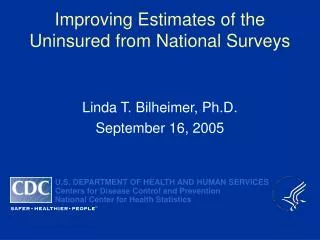
The National Surveys Linkage Project Dr Roger Harrison, Bolton PCT & EPHU Prof. Heller, EPHU Prof. Baker & Mr Barrow, IPHRP Linking Data: Understanding the past and looking into the future. May 7th 2004
National Survey of Surveys • To find out how many population based health/lifestyle surveys carried out • Limited to n>3,000 & post 1989 • Area-based limitation to LA Borough/PCT or Region • Postal questionnaire to all DPH & Information Analysts in PCTs & PH Observatories • Conducted in November 2003
National Survey of Surveys • @ 300 organisations were sent a questionnaire • 62 returned (20%) • 53 individual surveys identified • Sample size in each survey 3,000 to 25,000 • Individual response rates from 30% to 70%
National Survey of Surveys • Coverage: extremes of North & South • Providing a total sample size of @250,000 adultsat the level of the general population
Where is the data? • Information remains isolated within each locality • Data/information restricted to ‘internal’ access • Often not published in scientific/academic literature • Until now, no previous attempt to merge individual survey data sets • ?? Huge loss of information potential
Survey similarities? • Most surveys used an in-house questionnaire • Questions often based on national surveys • Some developed by the same academic unit • Some begged/borrowed/stealed from previous localities
Survey similarities FHSA/GP Register Postal Questionnaire Social class Social capital Neighbourhood aspects Physical activity Diet Smoking Use of health/social services Age Sex Ethnicity General health Specific health Mental health
Detailed survey-content Detailed analysis of 20 survey instruments obtained confirmed similarities • For example, the surveys had information on: • Sex (19 of 20) • BMI (17 of 20) • Smoking (18 of 20) Alcohol intake p.w (19 of 20) Fruit/veg intake p.w. (17 of 20) Physical activity (19 of 20)
Missed opportunities with individual surveys • No storage of postcodes • Analysis by social deprivation may not be possible • No storage of person-identifiers such as NHS number • Not possible to link with morbidity/mortality datasets (eg. NHS Mortality Flagging) • No previous or future linkage with same subjects in repeat surveys • Failure to gain benefits from longitudinal analyses
Lost opportunities from non-comparative analyses • Larger n = power + precision • Particular benefit for minority groups/specific issues not powered in relatively smaller surveys • Possibilities for benchmarking • To influence/improve local service provision • Exploration of differences/similarities in health & lifestyle associations • To increase understanding of factors influencing health/well-being • Examining the impact of ‘natural experiments’ • To inform the effectiveness of interventions in the ‘real world’
“that’s another fine mess we’re in!” ? Feasibility
Area level data National/local policies Type & extent of service provision Service use Additional demographics Individual surveys Outcomes Morbidity Mortality Service use Repeated/longitudinal analysis
Service/investigator support World Wide Web Guides on Methodology Sample size Question selection Analysis Outputs Automated analysis Cross-survey comparisons Question Bank UK Data Archive Data entry interface