Download
1 / 23
230 likes | 423 Vues
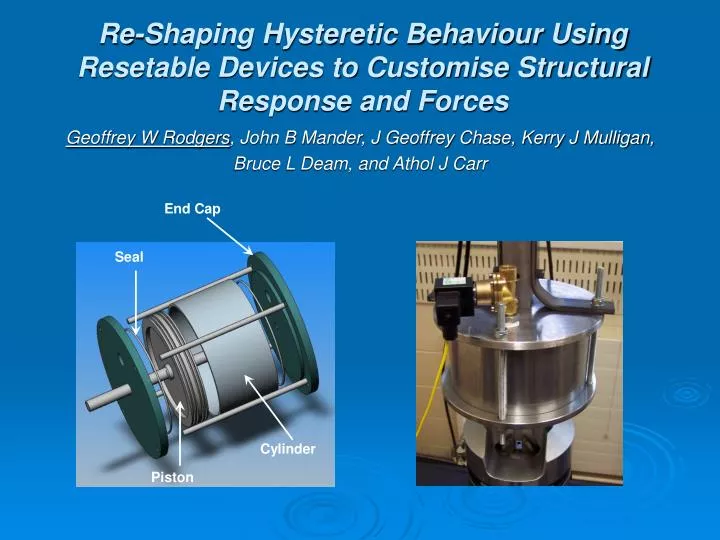
End Cap. Seal. Cylinder. Piston. Re-Shaping Hysteretic Behaviour Using Resetable Devices to Customise Structural Response and Forces. Geoffrey W Rodgers , John B Mander, J Geoffrey Chase, Kerry J Mulligan, Bruce L Deam, and Athol J Carr. a). Valve. b). Valves. Cylinder. Piston.

E N D
End Cap Seal Cylinder Piston Re-Shaping Hysteretic Behaviour Using Resetable Devices to Customise Structural Response and Forces Geoffrey W Rodgers, John B Mander, J Geoffrey Chase, Kerry J Mulligan, Bruce L Deam, and Athol J Carr
a) Valve b) Valves Cylinder Piston Cylinder Piston Device Design Independent two chamber design allows broader range of control laws
Viscous Damper Resist all velocity Resist all motion 1-4 Resetable Resist motion away from 0 1-3 Resetable Resist motion toward 0 2-4 Resetable Overall Customised Hysteresis Only the 2-4 control law does not increase base-shear
Semi-Active Resetable Device Model Simulink Models Experimental Test Results
1-3 control 2-4 control Simplified Linear Model 1-4 control Less computationally expensive, with no anticipated loss of accuracy or generality
Response Spectra Average response spectra for different control laws How do the different control laws perform relative to one another?
Reduction Factors Divide results with additional stiffness by the uncontrolled case More clearly represent reductions achieved with each control law Largest reductions seen for the 1-4 device – This device acts over a larger percentage of each cycle and will consequently have longer active strokes Note the apparent invariance to the type of ground motion encountered
Suite Dependence Normalise the average reduction factor from each suite to the reduction factors for all ground motions to investigate suite dependence Values close to unity across the spectrum indicates an invariance to the type of ground motion (near field vs. far field) encountered – indicating a robustness of this form of control
Spread of Results • Log-normal co-efficient of variation or dispersion factor • Indicates the spread of the results within a ground motion suite • Largest spread is seen for the 1-4 device indicating more variability • Both the 1-3 and 2-4 device show a tighter spread
Structural Force The base-shear force for a linear, un-damped structure - Gives an indication of the required column strength Largest reductions for the 1-4 device – consistent with other metric Similar performance for the 1-3 and 2-4 devices
Base-Shear The sum of the structural force and the resetable device force - Gives an indication of the required foundation strength Only the 2-4 device reduces base shear across the entire spectrum The 1-3 and 1-4 devices increase base-shear by as much as 60% The 2-4 device provides similar reductions in displacement and structural force as the 1-3 device, andalso reduces base-shear
Base-Shear Force Structural Force Control laws compared Averaging across suites more clearly indicates the relative advantage of the control laws 1-3 and 2-4 show similar reductions in structural force, but are outperformed by the 1-4 device Only the 2-4 device reduces base-shear, whereas both the 1-3 and 1-4 increase base-shear by as much as 60%
where Displacement Spectral Area Numerically integrate the area under the response spectra in the seismically important T = 0.5 to 2.5 second range. An indication of the average displacement reduction factor in the constant velocity region of the spectra Fit empirical equations to estimate damping reduction factors where C = 1.43, 1.59, and 5.75 for the 1-3, 2-4 and 1-4 devices
Black Line is Empirical Equation How accurate are these equations? Re-plot the displacement reduction factors, with the reduction factors from the empirical equations Although variations can be seen above T = 3.0seconds, equations are appropriate over the constant velocity region from T = 0.5 – 3.0 secs
ADRS Acceleration-Displacement Response Spectra Relate additional resetable stiffness to design guidelines Empirical reduction factor equations create a “standard design platform” for a structural engineer to safely and effectively add resetable devices to their design.
Summary • The 1-4 device outperforms both the 1-3 and 2-4 device for displacement response and structural force as it acts over the full response cycle, has longer active strokes, and consequently higher energy dissipation • Both the 1-3 and 1-4 devices provide a reduction in structural force and displacement response, but increase base-shear up to 60% • The 2-4 device reduces both structural force and base-shear • All three control laws are suite invariant indicating a robustness to the type of ground motion encountered • Empirical equations to approximate reduction factors allow incorporation into accepted performance based design metrics
Conclusions • Semi-active control enables customisation of overall structural hysteresis in novel ways not available with passive systems • The most applicable control law (of the selected few presented) depends on the application • New purpose designed structure • Retrofit application with limited foundation strength • Thus, device selection and implementation is a structural design problem rather than a control systems problem • The overall approach presented can be used to develop standard design metrics for any similar novel semi-active or passive systems/devices, thus creating a bridge to the design profession and a greater likelihood of uptake.
Acknowledgements Special thanks to Ms Kerry Mulligan and Professors Chase and Mander for their assistance with this research, as well as to our co-authors This research was funded by the NZ Earthquake Commission (EQC) Research Foundation and the New Zealand Tertiary Education Commission (TEC) Bright Futures Top Achievers Doctoral Scholarship Scheme
SATMD Concept • Upper or new stories added as segregated mass • Connections are of resetable devices and/or rubber bearings • Use 1-4 devices to resist all motion of upper stories and dissipate max energy • Goal 1: use upper stories as tuned mass • Goal 2: reduce displacements and thus shears in lower stories • How to tune?
Tuning and Method • Easy assumption = tune to 1st mode as with passive TMD (PTMD) • Better assumption = tune lower than first mode to enhance motion of device and thus the energy dissipated • Set SATMD stiffness to PTMD/5 (one fifth of stiffness) • Anything under PTMD/2 works pretty much equally well • Method: • Run suites of earthquakes and develop spectra (SAC project motions) • Compare PTMD with SATMD using 100% resetable devices • Use 20% of lower stories as SATMD/PTMD mass • Present 16th, 50th and 84th percentile results • Assume optimal tuning in PTMD for most conservative comparison • All results presented as reduction factors of base structure (y1) motion as compared to uncontrolled case and presented as a percentage (%) • Re-run some suites with non-linear structure for more realistic case
Linear Spectra Results • SATMD is much narrower than PTMD • All SATMD values < 100% • PTMD highly variable over suites • Differences are greatest in 1-3 second range of greatest interest for earthquakes • Again, optimal PTMD tuning is used Low Medium High
Non-Linear Results • Only low suite for most common events • Use Bouc-Wen model for structural non-linearity • Similar results overall to linear spectra case • PTMD even wider over suite with realistic structure • SATMD only a little wider • SATMD < 100% still even at 84th percentile
SATMD Summary • Concept shows significant promise in an area that may grow as developers and others seek to go upwards • Provides a novel way to obtain TMD like results without added mass • SATMD tuning does not require knowledge of exact masses or exact first mode frequency, as with standard passive PTMD. Therefore, it is very easy to design tuning • PTMD results are very wide and do not always reduce response – even with optimal tuning to first mode! • Reduction factor results, as presented for spectra over suites of events can be modelled to obtain design equations and integrate into standard design methods • Approach is basically the same as presented for directly controlled structures in prior work