Download
1 / 79
790 likes | 1.02k Vues
Surveillance and Epidemiologic Investigation. Angela Booth-Jones, PhD, RN Marian Rodgers, MSN, MPH, RN. How we view the world…. Pessimist: The glass is half empty. Optimist : The glass is half full. Epidemiologist : As compared to what?. Epidemiology. EPI DEMO LOGOS

E N D
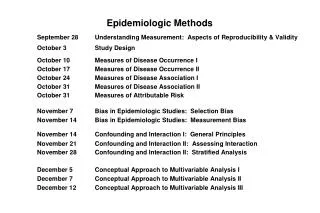
Surveillance and Epidemiologic Investigation Angela Booth-Jones, PhD, RN Marian Rodgers, MSN, MPH, RN
How we view the world….. Pessimist: The glass is half empty. Optimist: The glass is half full. Epidemiologist: As compared to what?
Epidemiology EPIDEMOLOGOS Upon,on,befallPeople,population,man the Study of The study of anything that happens to people “That which befalls man”
ClinicianEpidemiologist • Patient’s diagnostician • Investigations • Diagnosis • Therapy • Cure • Community’s diagnostician • Investigations • Predict trend • Control • Prevention
What is Epidemiology? • Epi means “over all” • Demos means “people” • Epi + Demos = “All of the people” • Definition: The study of the distribution and determinants of disease • Definition: The science behind disease control, prevention and public health • Epidemiologists plan, conduct, analyze and interpret medical research.
Poor Quality Care • Report: Crossing the Quality Chasm, 2001. • “The current health care system frequently fails to translate knowledge into practice and to apply new technology safely and appropriately” • Established 6 major aims for improving health care. Health care should be: • Safe, effective, patient-centered, timely, efficient, and equitable. Institute of Medicine (IOM) Committee on the Quality of Health Care in America
Research Methodologies for Cause-and-effect Relationships Criteria that must be met for a study to demonstrate a cause-and-effect relationship: • Observed Statistical Association There must be some statistical evidence of association between the cause and the effect. 2. Time Precedence The cause must occur first, followed by the effect. 3. Rule out Alternative Explanations for the Association
Research Methodologies for Cause-and-effect Relationships • The last criterion is the most difficult to satisfy. • A "true experiment" is a study design that is intended to rule out alternative explanations. • By definition, a "True Experiment" must have the following characteristics: • A study group and a control group. • Randomly assign of participants to the study and control groups. • Manipulation of an "independent variable" in the study group.
Understanding Statistics • Population • Description • Inference • BIG WORDS • Significant • Valid • No formulas • Focus on frequency
Qualitative Data Categorical Sex Diagnosis Anything that’s not a # Rank (1st, 2nd, etc) Quantitative Data Something you measure Age Weight Systolic BP Viral load Types of DATA
Data Comes from a Population • In clinical research the population of interest is typically human. • The population is who you want to infer to • We sample the population because we can’t measure everybody. • Our sample will not be perfect. • True random samples are extremely rare • Random sampling error
Describing the Population • Frequencies for categorical • Central tendency for continuous • Mean / median / mode • Dispersion • SD / range / IQR • Distribution • Normal (bell shaped) • Non-normal (hospital LOS) • Small numbers / non-normal data • Non-parametric tests
Statisticians Require Precise Statement of the Hypothesis • H0: There is no association between the exposure of interest and the outcome • H1: There is an association between the exposure and the outcome. • This association is not due to chance. • The direction of this association is not typically assumed.
Basic Inferences • Correlation • Pack years of smoking is positively associated with younger age of death. • (R square) • Association • Smokers die, on average, five years earlier than non-smokers. • Smokers are 8 X more likely to get lung cancer than non-smokers.
Rate of disease among smokers RR = Rate of disease among non-smokers Measure of Effect • Risk Ratio / Odds Ratio / Hazards Ratio • Not the same thing, but close enough. • Calculate point estimate and confidence interval of the ‘risk’ associated with an exposure. • Smoking • Drug X • If Rate ratio = 1 • There is no relationship between the exposure and the outcome • This is the ‘null’ value (remember null hypothesis?)
Normal Curve 95% confidence interval normally distributed statistic sample and measurements are valid
Interpreting Measures of Effect RR = 1: No Association RR >1: Risk Factor RR <1: Protective Factor
Crude vs Adjusted Analyses • Crude analysis – we only look at exposure and outcome. • Adjusted analysis – we adjust for potential ‘confounding variables’ • The existence of confounding obscures the true relationship between exposure and outcome. • We can control for confounding by adjusting for confounding variables using statistical models.
P value? • We can make a point estimate and a confidence interval. • What’s a p value? • Significant p value is an arbitrary number. • Does NOT measure the strength of association. • Measures the likelihood that the observed estimate is due to random sampling error. • P < 0.05 is, by convention, an indication of ‘statistical significance’.
If you have an ILLNESS, which result do you want? • Mean = 1.4 • SD = 0.1 • P <0.0005 • Mean = 4 • SD = 1.5 • P = 0.051
Hypothesis testing • Uses the p value • Or, does the confidence interval include the null value? • Looking at a, b, and c – which p value is: • p = 0.8 • p = 0.047 • p = 0.004 • CI is better than p value. a b c Figure 1. Risk of adverse pregnancy outcomes among women with asthma.
Types of Data Discrete Data-limited number of choices • Binary: two choices (yes/no) • Dead or alive • Disease-free or not • Categorical: more than two choices, not ordered • Race • Age group • Ordinal: more than two choices, ordered • Stages of a cancer • Likert scale for response • E.G. strongly agree, agree, neither agree or disagree, etc.
Types of data Continuous data • Theoretically infinite possible values (within physiologic limits) , including fractional values • Height, age, weight • Can be interval • Interval between measures has meaning. • Ratio of two interval data points has no meaning • Temperature in celsius, day of the year). • Can be ratio • Ratio of the measures has meaning • Weight, height
Types of Data • Why important? • The type of data defines: • The summary measures used • Mean, Standard deviation for continuous data • Proportions for discrete data • Statistics used for analysis: • Examples: • T-test for normally distributed continuous • Wilcoxon Rank Sum for non-normally distributed continuous
Descriptive Statistics • Characterize data set • Graphical presentation • Histograms • Frequency distribution • Box and whiskers plot • Numeric description • Mean, median, SD, interquartile range
HistogramContinuous Data No segmentation of data into groups
Frequency Distribution Segmentation of data into groups Discrete or continuous data
Sample Mean • Most commonly used measure of central tendency • Best applied in normally distributed continuous data. • Not applicable in categorical data • Definition: • Sum of all the values in a sample, divided by the number of values.
Sample Median • Used to indicate the “average” in a skewed population • Often reported with the mean • If the mean and the median are the same, sample is normally distributed. • It is the middle value from an ordered listing of the values • If an odd number of values, it is the middle value • If even number of values, it is the average of the two middle values. • Mid-value in interquartile range
Sample Mode • Infrequently reported as a value in studies. • Is the most common value • More frequently used to describe the distribution of data • Uni-modal, bi-modal, etc.
MEAN MODE MEDIAN Mean, Median, Mode & Tornadoes
Standard Error • A fundamental goal of statistical analysis is to estimate a parameter of a population based on a sample • The values of a specific variable from a sample are an estimate of the entire population of individuals who might have been eligible for the study. • A measure of the precision of a sample in estimating the population parameter.
Confidence Intervals • May be used to assess a single point estimate such as mean or proportion. • Most commonly used in assessing the estimate of the difference between two groups.
P Values • The probability that any observation is due to chance alone assuming that the null hypothesis is true • Typically, an estimate that has a p value of 0.05 or less is considered to be “statistically significant” or unlikely to occur due to chance alone. • The P value used is an arbitrary value • P value of 0.05 equals 1 in 20 chance • P value of 0.01 equals 1 in 100 chance • P value of 0.001 equals 1 in 1000 chance.
P Values and Confidence Intervals • P values provide less information than confidence intervals. • A P value provides only a probability that estimate is due to chance • A P value could be statistically significant but of limited clinical significance. • A very large study might find that a difference of .1 on a VAS Scale of 0 to 10 is statistically significant but it may be of no clinical significance • A large study might find many “significant” findings during multivariable analyses. “a large study dooms you to statistical significance” Anonymous Statistician
Errors • Type I error • Claiming a difference between two samples when in fact there is none. • Remember there is variability among samples- they might seem to come from different populations but they may not. • Also called the error. • Typically 0.05 is used
Errors • Type II error • Claiming there is no difference between two samples when in fact there is. • Also called a error. • The probability of not making a Type II error is 1 - , which is called the power of the test. • Hidden error because can’t be detected without a proper power analysis
Errors Test Result Truth
General Formula Numerator(x) The basic formula is as follows: Measure = Denominator(y)
Rate The basic formula for a rate is as follows: Number of cases or events occurring during a given time period Rate = Population at Risk during the same time period
Risk Ratio Risk for Group of primary interest The formula for Risk Ratio is : RR = Risk for Comparison Group
Rate Ratio The formula for Rate Ratio is : Rate for Group of primary interest RR = Rate for Comparison Group
Odds Ratio ad The formula for Odds Ratio is : Disease/Outcome bc OR = Exposure/Cause
Attributable Proportion The formula for attributable proportion is : Risk for exposed group – Risk for unexposed group AR = X 100% Risk for exposed group
Person-time Rate The formula for person time rate is : # cases during observation period PtR = X 10 n Time each person observed, Totaled for all person
Incidence Rate The formula for incidence rate is : # new cases of a specified disease reported during a given time interval IR = Average population during time interval