Download
1 / 12
120 likes | 231 Vues
This lesson covers the fundamentals of summary statistics and simulation, focusing on analyzing the age demographics of recent hires in a company. We will calculate the percentages of recent hires over 50, including hourly workers, and explore the characteristics of various data types through graphical representation. Moreover, students will engage in a simulation to determine average ages and assess if layoff events meet court standards for discrimination. The session aims to enhance understanding and practical application of statistical methods and inferential statistics.

E N D
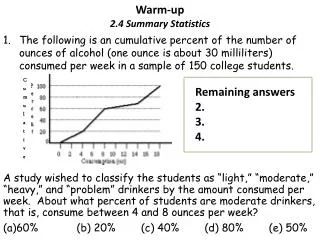
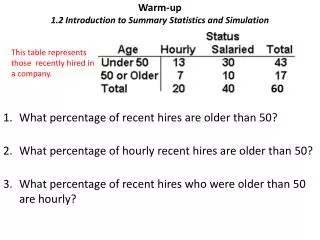
Warm-up1.2 Introduction to Summary Statistics and Simulation This table represents those recently hired in a company. • What percentage of recent hires are older than 50? • What percentage of hourly recent hires are older than 50? • What percentage of recent hires who were older than 50 are hourly?
Student of the day! • Each time we meet, after the warm-up, we will have a student of the day. • Someone’s introduction sheet will be displayed. • The student of the day can real some or all of their introduction sheet. • Please given the student of the day your complete attention. • When they are finished reading their introduction sheet, you can ask them questions.
Graphs Poster! • Find classmates that have the same type of graph. • Label your poster with your type of graph. • Glue the graphs on your poster. • Write the characteristics for your type of graph. a. What kind of data does it display? b. What do the graphs best demonstrate? c. Any other common characteristics that you notice (labels, axes, etc.). • These posters will be displayed in the classroom!
1.2 Introduction to Summary Statistics and Simulation • Back to the Westvaco case, looking at specifically Round 2 of lay offs for the hourly workers. • Averages (or means) are used to determine if there was age discrimination in the layoffs. Hourly workers of Round 2 (pg 12) Laid off Retained All Hourly Workers Ages of all hourly workers still present before Round 2 of Layoff: 23, 33, 35, 38, 48, 55, 55, 55, 56, 64 Averages (or means) are one of many summary statistics that we will learn.
Simulation Activity 1.2a (pg 13) • First answer D5 and D6 on pg 13. • Then complete the simulation described in Activity 1.2a. Directions for the simulation. Assign each of the ages these integers. Integer 1 2 3 4 5 6 7 8 9 10 Age 25 33 35 38 48 55 55 55 56 64 Use random integer function. Find the average of each set of ages the # represent. Then mark the 3 averages on the dot plot for the class. We will have 20 students come up and contribute their 3 averages to the dot plot so we have a total of 60 dots.
Simulation Results for the class How many of the results had an age of 58 or higher? Is this a likely event? Determining if something is a likely event is related to Inferential Statistics. Steps of a Simulation 1) Model 2) Repetition 3) Distribution 4) Conclusion
Statistical Significance pg. 16 D8. How unlikely is “too unlikely”? The probability you estimated in Activity 1.2a is in fact exactly equal to 0.05. In a typical court case, a probability of 0.025 or less is required to serve as evidence of discrimination. • Did the Round 2 layoffs of hourly workers in the Martin case meet the court requirement? b. If the probability in the Martin case had been 0.01 instead of 0.05, how would that have changed your conclusions? 0.10 instead of 0.05?
Quiz on 1.0 to 1.2 Next BlockFirst notebook check and test will be on Ch.1 and Ch. 2 • Know types of data: qualitative (bimodal, categorical) and quantitative (discrete, continuous) • Know which graphs fit certain types of data best. • Calculate proportions given a table. • Be able to determine if there is evidence of discrimination based the level normally used in a typical court case. • Be able to run and describe (display) the results of a simulation. The quiz will take between 20 – 30 minutes. Next block we will spend the first half of class watching a DVD that introduces the uses of statistics.