Download
1 / 84
840 likes | 1.26k Vues
Review of Capital Costs for Generation Technologies. Technical Advisory Subcommittee January 31, 2017. Arne Olson, Partner Doug Allen , Managing Consultant Femi Sawyerr , Associate. History.

E N D
Review of Capital Costs for Generation Technologies Technical Advisory Subcommittee January 31, 2017 Arne Olson, Partner Doug Allen, Managing Consultant Femi Sawyerr, Associate
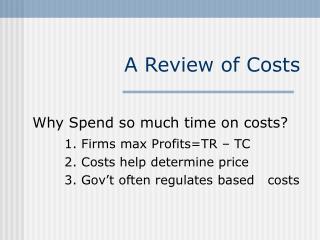
History • In 2009, E3 provided WECC with recommendations for capital costs of new electric generation technologies to use in its 10-year study cycles • Prior to this effort, the relative costs of WECC’s study cases could only be compared on a variable-cost basis • This effort allowed WECC to quantify relative scenario costs on a basis reflecting their actual prospective costs to ratepayers by combining variable & fixed costs • E3 has updated these capital cost assumptions several times to capture major changes in technology costs (e.g. solar PV) and ensure continued accuracy • Most recent update: 2014 Fixed Cost (E3 Capital Cost Tool) Total Cost Fuel and Variable Costs = +
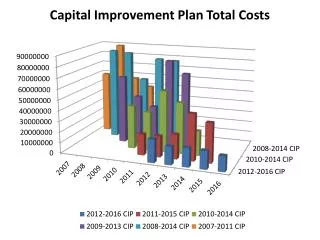
Background 20-Year Study • In preparation for its upcoming 20-year study plan, WECC has asked E3 to provide guidance on resource cost to use in that study • These capital costs will serve as an input to the 20-year study’s LTPT, allowing for the development of robust scenarios through cost minimization • This efforts builds on similar work done in early 2014 INPUTS MODELS STUDY RESULTS Long-Term Planning Tools (Capital Expansion Optimization) Twenty-Year Capital Expansion Plan Gen Capital Costs SCDT Generation Portfolio Tx Capital Costs NXT Transmission Topology Other Constraints
Study Approach • E3 uses a two-step process to develop capital cost assumptions for the 20-year studies: • Determine the cost to install a power plant today (2016) • Forecast reductions (if applicable) in technology capital costs over the next two decades • E3 uses capital cost estimates in conjunction with other assumptions in WECC studies to determine the annualized costs of new resources: • Financing structure and cost • Tax credits • Depreciation (MACRS) • Fixed O&M costs
Data Sources and Assumptions • E3 develops capital cost assumptions based on a literature review of public cost estimates from a variety of sources: • Government-contracted engineering studies • Regional or industry studies • Utility integrated resource plans (IRPs) • Publicly reported actual costs • WECC stakeholders provided review and feedback during January – April 2017 • All costs in this update are expressed in 2016 dollars unless explicitly stated otherwise • E3’s cost recommendations represent the “all-in” cost of building a new plant, including the cost of borrowing during construction • “Overnight” capital cost estimates are scaled up to allow for comparison with all-inclusive cost estimates
Wind and Solar Capital Cost Summary Updated *Following feedback from the CSP Alliance on Solar Thermal costs, E3 has updated previous categories (Solar Thermal with/without storage) to reflect the latest technical developments
Note on interpreting graphs • Graphs in the following presentation attempt to show all data points used to generate estimates • Includes data from past years which help identify trends over time and within data sources • Studies published by the same entity are grouped by color • For sources with a single point estimate for capital costs, estimates are denoted by □ • Many sources provided estimated ranges, which are denoted by Δ (high estimate) and Ο (low estimate) • E3 recommended estimates (past and current) are denoted by ◊ • The detailed data behind these graphs can be provided upon request
Solar Price Trends over Time • Solar capital costs have continued to decline sharply during recent years • Declines seen across all technologies, as much as 50% relative to 2014 estimates • Tight range of estimates for Residential/Commercial solar, wider for Utility-Scale solar • Cost advantage of larger systems has decreased in recent years • Smaller difference in the updated numbers between the “Small” and “Large” system capital cost estimates
Details on Cost Estimates • Data is presented according to type and size (where appropriate) of installation • Residential Rooftop • Commercial Rooftop • Utility-Scale Fixed Tilt • Utility-Scale Tracking • Data points collected from sources are shown over time to indicate the trend of cost evolutions in recent years • E3 estimate takes into account current cost estimates as well as changes over time relative to 2014 estimate
Residential Rooftop Solar Costs over Time E3 Recommendation: $2,900/kW-dc
Commercial Rooftop Solar Costs over Time E3 Recommendation: $2,600/kW-dc
Utility-Scale Fixed Tilt Solar Costs over Time E3 Recommendation: $1,500/kW-dc (1-20 MW) $1,300/kW-dc (20+ MW)
Utility-Scale Tracking Solar Costs over Time E3 Recommendation: $1,600/kW-dc (1-20 MW) $1,400/kW-dc (20+ MW)
Aligning Cost & Performance Assumptions for Solar PV • Solar PV capacities • Direct current (DC): sum of module nameplate rating • Alternating current (AC): inverter nameplate rating • Capital costs are typically reported relative to the system’s DC nameplate rating (in $/kW-dc), but can be expressed relative to the AC nameplate ratio by multiplying by the Inverter Loading Ratio Capital Cost ($/kW-ac) Capital Cost ($/kW-dc) Inverter Loading Ratio DC nameplate AC nameplate Chart shows industry average ILRs in recent years For more detail on the treatment of DC and AC capacity in WECC studies, see E3’s presentation to TAS (12-12-2013) Source: Utility-Scale Solar 2015: An Empirical Analysis of Cost, Performance and Pricing Trends in the United States (LBNL, 2016)
Recommended Assumptions • Values in the LBNL study cited above indicate that the recommended inverter loading ratios for the fixed tilt solar resources should be updated from their 2014 values: • Fixed tilt, utility: 1.35 • Tracking, utility: 1.30 • Rooftop: 1.20
Summary of Solar PV Recommendations • Capital costs expressed in $2016 • Comparison of DC and AC costs in E3 2016 update:
Comparison of Solar PV Recommendations to Past Recommendations • Solar costs have declined in recent years • Cost differences across the different types of solar have also declined
Wind Price Trends over Time • Wind capital costs have remained relatively constant over the past few years • Slight downward trend, but not approaching the cost decreases seen for solar • Data is often presented by region, but little indication of systematic price differences across regions • Data on Offshore Wind remains sparse • First offshore wind facility in the US came online this month • Previous E3 estimates were high relative to costs released since that update
Details on Cost Estimates • Data/estimates are presented for both onshore and offshore wind • Data points are presented over time to indicate the trend of cost evolutions in recent years • E3 estimate takes into account current cost estimates as well as changes over time relative to 2014 estimate
Cost Differences by Region • Data from LBNL indicates that wind capital costs are likely to vary according to the region in which the project is located • Projects in the “Interior” zone (Rocky Mountains) are less expensive to install than those in the “West” zone • E3 recommends reflecting this difference in capital cost estimates • Within region, E3 applies state-specific capital cost multipliers to reflect variation across state lines Source: 2015 Wind Technologies Market Report, LBNL
Onshore Wind Solar Costs over Time E3 Recommendation: $1,700/kW-ac (Interior) $2,000/kW-ac (West)
Offshore Wind Costs over Time E3 Recommendation: $4,500/kW-ac
Summary of Wind Capital Cost Recommendations • Capital costs expressed in $2016 Cost decrease in both categories relative to 2014 update (6-20% for onshore, 29% for offshore)
Cost Trajectory Methodology • In 2012, E3 developed methodologies to create plausible trajectories of future generation capital costs • Solar PV: application of learning curves to present-day costs • 20% learning rate for modules; 10% (Utility-Scale) or 15% (Rooftop) for BOS • IEA Medium-Term Outlook forecast of global installations • Wind: application of learning curves to present-day costs: • 10% learning rate • IEA Medium-Term Outlook forecast of global installations • The general framework used to project future costs remain valid, but E3 has updated assumptions based on improved/new data and information and included projections for battery storage
Learning Curve Theory • Learning curves describe an observed empirical relationship between the cumulative experience in the production of a good and the cost to produce it • Increased experience leads to lower costs due to efficiency gains in the production process • The functional form for the learning curve is empirically derived and does not have a direct theoretical foundation • The learning rate represents the expected decrease in costs with a doubling of experience • Global installed capacity is used as a proxy for cumulative experience in the electric sector
Components of Solar PV Costs • For each segment of solar PV, E3 has broken capital costs out into three categories: • Module costs: direct cost of photovoltaic modules • Non-module hard costs: costs of inverter, racking, electrical equipment, etc. • “Soft costs”: labor, permitting fees, etc. • Cost reductions in each category will result from different drivers and may not apply equally across all market segments
Module Cost Reductions • Historically, over the long-term, modules have stayed relatively close to a learning rate of 20% • See International Technology Roadmap for Photovoltaic 2015 Results, available at http://www.itrpv.net • Current module prices are below long-term learning curve • Potential for cost reductions due to module cost declines is expected to be limited until trend returns to long-run average
Forecasting Future Module Prices • E3’s projection of module costs relies on the extrapolation of global PV forecast from the IEA’s Medium Term Renewable Energy Outlook • Module prices are assumed to remain stable at today’s level until the long-term trend “catches up” • Learning curve approach supports anecdotal evidence that suggests further reductions in module costs are limited
Non-Module Cost Reduction Potential • In 2014, E3 assumed that non-module cost components for rooftop PV would follow a learning rate of 15% while those for utility-scale PV would follow a 10% learning rate • Reflected substantial effort to identify cost reduction potential in rooftop PV systems • Reported “costs” of rooftop systems are increasingly influenced by the retail rate structures that enable their viability • Fair market value of PV exceeds actual system costs, allowing for more rapid cost declines with increase experience / competition • Learning rates are applied based on global installed capacity • E3 believes these learning rates are still appropriate for use in 2016 20% reduction relative to 2016 29% reduction relative to 2016
Comparison to Prior Recommendations: Residential and Commercial • Residential and commercial rooftop solar PV costs have been revised downward from the 2014 E3 Update reflecting recent market cost declines
Comparison to Prior Recommendations: Utility Scale Fixed Tilt
Forecasting Future Turbine Prices • Learning rates are based on meta-analysis of literature presented in Rubin (2015)2 • Estimated at 12% for both on and offshore turbines • E3’s projection of module costs relies on the extrapolation of global wind forecast from the Global Wind Energy Council • Total installed capacity increases to ~800 GW in 2020, ~2,800 GW in 2040 • Offshore wind increases from <3% of global total in 2015 to ~25% of global total in 20401 1 – Share of offshore wind is taken from IEA projections 2 – Rubin, E., I. Azevedo, P. Jaramillo, S. Yeh. “A review of learning rates for electricity supply technologies.” Energy Policy 86, pp. 198-218.
Turbine Price Evolution over Time • Due to relative maturity of onshore wind industry, offshore costs decline more rapidly over the next 15-20 years • Past 2030, growth in offshore wind slows to levels near that for onshore 51% below 2016 estimate 24% below 2016 estimate
Characterizing Storage Options • The breadth of potential storage applications is wide, and the appropriate technology and its characteristics will vary considerably Sources:Sandia (2013), Indiana State Utility Forecasting Group (2013)
System Characteristics • The table below compares some of the operating characteristics of the energy storage technologies examined here
Recommendations – Pumped Hydro Storage • Pumped hydro is a relatively mature technology that can scale-up to over 1 GW although costs are highly dependent on the specific site • Recent projects in PacifiCorp’s territory (JD Pool, Swan Lake, and Seminoe) estimated at $2,600 - $2,700/ kW E3 Recommendation: $2,500/kW-ac
Lithium Ion Battery Costs by Storage Capacity • Costs presented according to storage life • Tighter range of costs than that seen for flow batteries • Likely due to wide range of potential materials that can be used in flow batteries E3 Recommendation: 4-Hour: $3,000/kW-ac, $750/kWh 8-Hour, $5,000/kW-ac, $625/kWh
Flow Battery Costs by Storage Capacity • Costs presented according to storage life • Wide range of costs based on materials used • Li-Ion batteries expected to have minor cost advantage E3 Recommendation: 4-Hour: $3,000/kW-ac, $750/kWh 8-Hour, $6,000/kW-ac, $750/kWh
Battery cost projections • Dramatic changes since 2005 • These cost improvement trends are expected to continue into the 2020s • Because of widespread use in other sectors, however, cannot apply “learning curve” methodology used elsewhere • Instead, cost projections are based on expected overall % declines before the technology reaches “maturity” Source: Nykvist et al. (2015), http://www.nature.com/nclimate/journal/v5/n4/full/nclimate2564.html
Forecasting Future Battery Prices • Price reduction rates are based on data presented by Lazard (2016)1 • Li-Ion: A 6% reduction rate was used; average of the high and low values predicted by Lazard • Flow: A 5.5% reduction rate was used; average of the high and low values predicted by Lazard • Technology reaches maturity by 2028, after which reductions are minimal Updated 1 – Lazard, Levelized Cost of Storage v2.0, 2016