Download
1 / 38
380 likes | 530 Vues
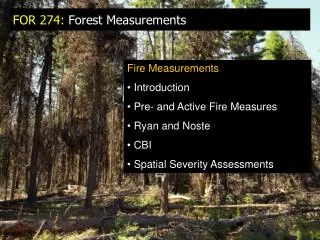
Fire Measurements Introduction Pre- and Active Fire Measures Ryan and Noste CBI Spatial Severity Assessments. FOR 274: Forest Measurements. Shifting Earth Science Priorities.

E N D
Fire Measurements • Introduction • Pre- and Active Fire Measures • Ryan and Noste • CBI • Spatial Severity Assessments FOR 274: Forest Measurements
Shifting Earth Science Priorities Research is needed to understand the complex inter-connected roles of biological and climate systems, while understanding the consequences for society, mitigation, and feedbacks in a changing climate. Reid et al. (Science, 2009)
Shifting Earth Science Priorities To make meaningful management decisions in the face of uncertainty, physical drivers of climate and their biological response need to be mechanistically connected. However, understanding of the impacts of climate change is lacking at regional and local scales, where on-the-ground management activities are implemented. Evaluating Progress of the U.S. Climate Change Science Program: Methods and Preliminary Results (NRC, 2007))
Importance of Wildland Fires • Key element in the Earth system. • Disturbance agent that rapidly transfers biogeochemical and hydrological stocks stored in terrestrial vegetation to the atmosphere. • Affects vegetation, soils, and airflow with substantial effects on the terrestrial, subterranean, and atmospheric cycles within regional water- and air-sheds. • Considerable ecological, economic, and social impacts, prompting policy changes and other societal responses to land management.
Wildland Fire Challenges • The principal challenges are to quantify the: • Structure and heterogeneity of pre-fire fuels • Energy released during combustion • Landscape-scale impacts on soils and vegetation The Grand Challenge is how to integrate the pre-, active-, and post-fire measurements and physical process models into a robust and well documented framework Kremens, Smith and Dickinson (2010)
The Next Generation of Fire Spread Models The WFDS model has been developed by the National institute of Standards and Technology (NIST) ) http://www2.bfrl.nist.gov/userpages/wmell/public.html#ICFEM_wfds_sim
These physics-based fire spread models require parameterization and validation with real-world examples. This highlights the need to measure the pre-fire fuels, active fire properties, and post-fire effects in a coincident manner. The data inputs to these models have to be of an adequate spatial and temporal scale to capture natural variations The research outputs need to sync with those predicted by the models!
Characterization of the Pre-Fire Fuels Ground based LiDAR enable fuel voxels to be characterized. Hiers et al (2009) Image Source: MJ Falkowski
Introducing the Fire Energy Field This describes the radiant, conductive, and convective energy flow produced by a wildland fire. To fully characterize the energy field the directions and magnitude of all the component would be known – this would enable reliable predictions of fire effects
Energy emitted (q ) at a given wavelength and temperature is given by the Stefan-Boltzmann law: q = ε T4 [ = 5.67 x 10⁻⁸ watts/m2/K4] ε = emissivity, 0 <= ε <= 1, and is the efficiency that surface emits energy when compared to a black body Fire-Remote Sensing Essentials: Emittance
Fires follow the curve Wooster et al 2005
How Much Fuel (Carbon) is Combusted? Fire Line Intensity: I = HWR H is known Need Measurement of: W – Fuel Combusted R – Rate of Spread In Crown Fires W can be ‘very Difficult’
Energy= εσT4 Andrews and Rothermel 1982 – Heat Per Unit Area:
This Equation can be Applied to Satellite Data Wooster, M.J., et al. (2005) Retrieval of biomass combustion rates and totals from fire radiative power observations: FRP derivation and calibration relationships between biomass consumption and fire radiative energy release, JGR, 110, D24311, doi:10.1029/2005JD006318,
0 3 6 9 11 Day of Burn
A Week of W: Southern Africa Roberts, G., et al. (2005) Retrieval of biomass combustion rates and totals from fire radiative power observations: Application to southern Africa using geostationary SEVIRI Imagery, JGR, 110, D21111, doi: 10.1029/2005JD006018
A Week of W: Southern Africa Biomass Combusted = 3.2 million tonnes (1.5 Mtonnes C) (4.3-5.1 million tonnes adj. for cloud) Cloud effect Roberts, G., et al. (2005) Retrieval of biomass combustion rates and totals from fire radiative power observations: Application to southern Africa using geostationary SEVIRI Imagery, JGR, 110, D21111, doi: 10.1029/2005JD006018
Using Heat Flux vs. Smoke Emission Relations: Improving Regional Emissions/Air Quality Modeling Ichoku and Kaufman (2005)
Measure Heat Flux & Emissions over Space and Time Provide Inputs into Regional Smoke Transport Models
Evaluate Contributions Relative to Agriculture/Industry Improving Measures of the Wildfire Background With Fire Inputs Without Fire Inputs Difference Smith, Lamb (WSU), and Potter (PNW) – JFSP (in review)
Remote Sensing of Fires: Surface Changes Pre-fire surfaces: The fuels or green and yellow (senesced) vegetation Post-fire surfaces: charred vegetation, mineral (white) ash, exposed soils
Remote Sensing of Fires: Surface Changes Visible (TM bands 1-3): sharp drop that generally recovers with re-growth Near infrared (TM band 4): very sharp drop that slowly recovers with re-growth
Remote Sensing of Fires: Surface Changes Long Near-infrared (TM bands 5 and 7): increase post-fire Thermal (TM band 6): increase post-fire
Remote Sensing of Fires: Surface Changes These noticeable changes allow us to easily produce maps of the area burned
Remote Sensing of Fires: Surface Changes Several options exist: One of the most popular in N. America is the dNBR method NIR – SWIR NIR + SWIR NBR = Where, dNBR = NBRprefire – NBRpostfire In terms of fire management, dNBR maps are often used to produce Burned Area
Fire Intensity, Fire Severity, and Burn Severity… From Jain T, Pilliod D, Graham R (2004) Tongue-tied. Wildfire. 4, 22-26. [After: DeBano LF, Neary DG, Ffolliott PF (1998) ‘Fire’s effects on ecosystems.’ (John Wiley and Sons: New York) 333 pp. Source of Confusion: The Terms Fire Severity and Burn Severity are used inconsistently in the Remote Sensing literature
Van Wagtendonk et al (2004); Epting et al (2005) Lentile et al (2006) Subjective & Value Laden Term ∆NBR: non-linear asymptotic relationship with CBI that varies with sensor spatial resolution and environment The Severity Concern ∆NBR Highlights need to evaluate alternative methods
The Burn Severity Map Concern Multiple Agency’s use the dNBR method dNBR is a good Measure of Current Canopy Condition dNBR BAER
The Severity Concern • Value Laden Term • Negative Connotations: severity = bad • Public & Policy Miscommunication • Multiple Definitions in the Literature * Fire duration and heat transfer * Vegetation consumption * White ash production * Change in surface reflectance * Alteration in soil properties * Changes in the litter and duff layers * Long-term vegetation mortality and recovery
Pre-Fire Condition Post Fire Effects Active Fire Characteristics During Combustion Following Combustion Simplifying the Fire Disturbance Continuum: • Limit use of the Terms Fire Severity & Burn Severity • Describe and Quantify the Actual Processes Being Assessed • Make sure that satellites CAN also measure these processes
The method describes fire severity in terms of the heat received by overstory vegetation and the soil. • 5 flame length classes (feet) • Class scorch ht. tree mortality (dbh) • 1. 0-2 ft 0-9 < 1.0 • 2. 2-4 ft 9-24 1 - 4.9 • 3. 4-8 ft 24-64 5 - 8.9 • 4. 8-12 ft 64-116 9 - 13 • 5. >12 ft >116 > 13 • Ground char classes: • %Deep %Mod %Light • Light Char <2% <15% >80% • Moderate <10% >15% • Deep >10% >80% Field Measures of Post-Fire Effects: Ryan and Noste
The method describes fire severity in terms of the heat received by overstory vegetation and the soil. Field Measures of Post-Fire Effects: Ryan and Noste
Used with dNBR • Measures scaled 0-3 • 15m radius plots • Uses 5 Strata: • Soil • Understory • Shrubs / saplings • sub-canopy trees • overstory Field Measures of Post-Fire Effects: CBI With dNBR or CBI how do you know whether effects are caused by the fire and if they are what magnitude of those effects are due to the fire?
“Byram’s Fire Intensity equation contains about as much information about a fire’s behavior as can be crammed into one number.” Van Wagner (1977)