THỰC HÀNH EVIEWS
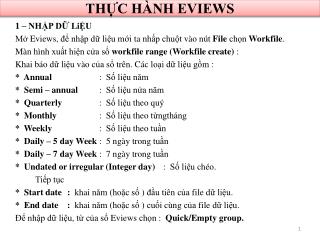
THỰC HÀNH EVIEWS. 1 – NHẬP DỮ LiỆU Mở Eviews , để nhập dữ liệu mới ta nhấp chuột vào nút File chọn Workfile . Màn hình xuất hiện cửa sổ workfile range ( Workfile create) : Khai báo dữ liệu vào của sổ trên . Các loại dữ liệu gồm : * Annual : Số liệu năm

THỰC HÀNH EVIEWS
E N D
Presentation Transcript
THỰC HÀNH EVIEWS 1 – NHẬP DỮ LiỆU MởEviews, đểnhậpdữliệumớitanhấpchuộtvàonútFilechọnWorkfile. Mànhìnhxuấthiệncửasổworkfile range (Workfile create) : Khaibáodữliệuvàocủasổtrên. Cácloạidữliệugồm : * Annual : Sốliệunăm * Semi – annual : Sốliệunửanăm * Quarterly : Sốliệutheoquý * Monthly : Sốliệutheotừngtháng * Weekly : Sốliệutheotuần * Daily – 5 day Week : 5 ngàytrongtuần * Daily – 7 day Week : 7 ngàytrongtuần * Undated or irregular (Integer day) : Sốliệuchéo. Tiếptục * Start date : khainăm (hoặcsố ) đầutiêncủa file dữliệu. * End date :khainăm (hoặcsố ) cuốicùngcủa file dữliệu. Đểnhậpdữliệu, từcủasổEviewschọn : Quick/Empty group.
2 – VẼ ĐỒ THỊ TừcủasổEviewschọnQuick/Graph : Mànhìnhxuấthiệncủasổ Series List : Đưabiếnlêntrụchoành (X) trước; Đưabiếnlêntrụctung (Y) sau. Tiếptụcchọncácloạibiểuđồsau : - Line & Symbol : đườngkẻ - Bar : đườngvạchđậm- Spike : đườngvạchđơn - Area : diệntích- Area Band : diệntích - Mixed with Lines : đườngvạchđậmvàđườngkẻ - Dot Plot : điểmphântán - Error Bar : saisố - Hight – Low (open – close) : đườngkẻnhỏ - Scatter : điểmphânbổ - XY line : XY Area : - Pie : kiểubiểuđồhìnhtròn. - Distribution : phânphối - Quantile – Quan tile : - Poxplot :
3 – TÌM HÀM HỒI QUY MẪU Vídụ : tacócácbiếnsau. Biếnphụthuộc : Y Biếnđộclập : X2 , X3 , Z Nếumuốntìmhàmhồiquymẫucủa Y theo X2 , X3và Z : TừcủasổEviews chon QuickrồichọntiếpEstimation Equation , xuấthiệnbảng Equation Estimation . Trongkhung (nơicódấunhắc) gõ : Y C X2 X3 Z Nhấn OK , tasẽcóbảngkếtquảphântíchhồiquy.
4 – MỘT SỐ HÀM TRONG EVIEWS + Cộng ; - Trừ ; * Nhân ; / Chia ; ^ Nânglênlũythừa ; > Lớnhơn , < Nhỏhơn ; <= Nhỏhơnhoặcbằng ; >= : Lớnhơnhoặcbằng ; D(X) : Saiphânbậc I, D(X) = Xt – Xt-1 ; D(X,n) : saiphânbậc n ; LOG(X) : Ln(X) ; EXP(X) : ex ABS(X) : Giátrịtuyệtđốicủa X ; SQR(X) : Cănbậc 2 của X ; @SUM(X) : Tổngcủa X ; @MEAN(X) : Trungbìnhcủa X ; @VAR(X) : Phươngsaicủa X ; @COV(X,Y) : Hiệpphươngsaicủa X và Y ; @COR(X,Y) : Hệsốtươngquangiữahaibiến X và Y. @TREND(d) : Biếnxuthếthờigianchuẩnhóavề 0 ở thờikỳ d ; @SEAS(d) : Biếngiảtheomùabằng 1 khiquýhoặcthángbằng d, bằngkhôngnếukhác d.
5 – MỘT SỐ DẠNG HÀM HỒI QUY Giảsửtacósốliệucủacácbiến Y và X. Nếutìmhàmhồiquytheo X và Yt-1 (biếntrễ) thìcâulệnhlà : Y C X Y(-1) Nếucầntìmln(Y) theoln(X) : log(Y) C log(X) Nếucầntìm Y theo X và X2 : Y C X X^2 Nếutìmhàmhồiquykhôngsửdụngtoànbộquansátcủamẫu, thì ở phần Sample củabảngEquation Estimation takhaiđúngbằngkhoảngsốliệuchúngtacầntìm.
6 – TÌM MA TRẬN TƯƠNG QUAN Giảsửtacómẫugồmcácbiến Y, X2, X3đãcho. Đểtìm ma trậntươngquancủacácbiếnnày : ChọnQuick/Group Statistics/CorrelationstacóbảngSeries List. TừcủasổSeries Listtađánhcácbiếncầntìmvào, sauđó chon OK tacókếtquả. 7 – TÌM MA TRẬN HiỆP PHƯƠNG SAI Trướchếttatìmhàmhồiquymẫu, từcủasổcủahàmhồiquymẫutavàoView/Covariance Matrix. Nhấn OK chúngtasẽcókếtquả.
CÁC LOẠI KiỂM ĐỊNH ĐểthựchiệncácloạikiểmđịnhbằngEviews, saukhiướclượngmôhìnhhồiquygốctừcủasổEquantion : UNTITLED chọnViewsẽxuấthiệncáchàmkiểmđịnhsau : * Coefficient Tests : - Confidence Ellipse. - Wald – Coefficient Restrictions. - Omitted Variables – Likelihood Ratio. - Redundant Variables – Likelihood Ratio. - Factor Breakpoint Test.
* Residual Tests : - Correlogram – Q-Statistics. - Correlogram Squared Residuals. - Histogram – Normality Test. - Serial Correlation LM Test. - Heteroskedasticity Test. * Stability Tests : - Chow Breakpoint Test. - Quandt – Andrews Breakpoint Test. - Chow Forecast Test. - Ramsey RESET Test. - Recursive Estimates (OLS only)