Download

1 / 25
250 likes | 366 Vues
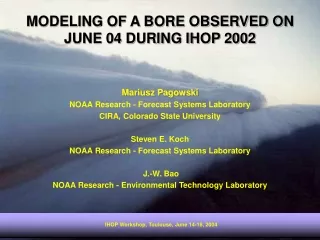
Multi-Platform Observations of a Bore Event on 4 June during IHOP. Steven E. Koch Frederic Fabry, Bart Geerts, Tammy Weckwerth, James Wilson, Dave Parsons, and Wayne Feltz. Data used in Study of this Bore Event. S-POL reflectivity, (radial velocity), refractivity Surface mesoanalysis plots

E N D
Multi-Platform Observations of a Bore Event on 4 June during IHOP Steven E. Koch Frederic Fabry, Bart Geerts, Tammy Weckwerth, James Wilson, Dave Parsons, and Wayne Feltz
Data used in Study of this Bore Event • S-POL reflectivity, (radial velocity), refractivity • Surface mesoanalysis plots • Mesonet time series, incl.refractivity calculations • AERI & CLASS thermodynamic structure evolution • FM-CW, HARLIE, MAPR, (RAMAN lidar), (GLOW) • UW King Air flight-level data • High-resolution MM5 simulations (next talk)
Computation of Refractivity from Surface Data Refractivity Vapor Pressure
UWKA Flight-level data FM-CW Display of Bore B
SE NW UW King Air Data FL 1850 m AGL • KA penetrated solitary waves at the top of the bore. The waves are ranked in amplitude (as in FM-CW). • 3C cooling and 4 g/kg more moisture found at this level behind the bore (NW) – unlike the drying/warming seen in SPOL near-sfc refractivity. • Vertical motions are in phase quadrature with theta and u/v, as in a typical gravity wave, but strangely out of phase with pressure fluctuations. • Pressure variations are mainly a response of the aircraft to the vertical motion field. Mean 1.2 m/s updraft over 30 sec produces 35 m ascent or 3.5 mb hydrostatic pressure decrease. potential temperature temperature Wave propagation vertical air velocity static pressure (u,v) theta-e mixing ratio
Potential Temperature Relative Humidity AERI and ISS Detection of Bores A & B
Conclusions • Two bores or solitons observed as fine lines in S-POL reflectivity and by FM-CW, MAPR, ISS, Mesonet, UWKA data systems: • Bore A occurred along an outflow boundary that propagated eastward from the Oklahoma Panhandle • Bore B occurred along a cold front enhanced by postfrontal convection in northwestern Kansas • Solitary waves developed to the rear of each leading fine line atop a 700 – 1000 m deep surface stable layer. Depth of stable layer increased by 0.6 km with passage of leading wave in bores A and B. • Solitary wave characteristics: periodicity = 15 – 30 min, horizontal wavelength = 10 – 20 km, phase speed = 11.4 – 12.6 m/s. Waves exhibited amplitude-ordering (leading wave always the largest one).
Conclusions • Pronounced reduction in refractivity due to drying in surface layer occurred when the leading pressure jump was relatively strong. • Cooling & moistening aloft occurring with passage of both bores a likely result of adiabatic lifting (seen in AERI data and UWKA data for Bore B). UWKA pressure data is confusing. • Bore A appears to have been a soliton on a surface inversion layer. Bore B occurred at a higher elevation of 1.2 km as the inversion had lifted by that time, but problems remain with FM-CW data interpretation. It appears to have been a weakening soliton. • Need to understand better why drying (reduction of refractivity) only occurs at certain times. Analysis of MAPR, GLOW, & SPOL wind data, additional mesonet data, and UWKA data will be needed.