Download

1 / 29
300 likes | 438 Vues
Science Skills. Chapter One. 1-1 What is science?. Science From Curiosity Curiosity is the basis of science. If something is invisible, does it exist? Demonstration: What do you predict will happen if the jar is covered? Explain.

E N D
Science Skills Chapter One
1-1 What is science? • Science From Curiosity Curiosity is the basis of science. • If something is invisible, does it exist? • Demonstration: What do you predict will happen if the jar is covered? Explain. What invisible substances did you assume in your explanation? Science begins with curiosity and often ends with discovery.
Science and Technology Technology is the use of knowledge to solve practical problems. Goal of science = to expand knowledge Goal of technology = to apply that knowledge Science and Technology are interdependent Advances in one leads to advances in the other. Demonstration: Compass Discussion: Advances in phones
Physical Science: • Chemistry is the study of composition, structure, properties, and reactions of matter. Physics is the study of matter and energy and the interactions between the two through forces and motion. • Earth and Space Science: • Earth science is the application of physics and chemistry to the study of Earth and its foundation is geology, the study of the origin, history, and structure of Earth’s rocks. Modern Earth science includes the study of systems which may include living organisms. • Astronomy is the foundation of space science . It is the study of the universe beyond Earth, including the sun moon, planets, and stars. • Life Science: • Life science is the study of living things known as biology, the physics and chemistry of living things. It is also the study of the origin and behavior of living things. • What is the problem with subdividing science into different areas? • What is physical science?
The Big Ideas of Physical Science • Space and Time The universe is very old and very big! • Matter and Change Only a small amount of the universe is matter (having volume and mass) On Earth matter is usually solid, liquid or gas and is made up of atoms (which are made up of electrons, protons and neutrons) • Forces and Motion Forces cause changes in motion. Forces can be calculated. • Energy Energy comes in many forms. Kinetic energy Potential energy Energy in matter itself Energy can be transferred; it is never destroyed
Science and Your Perspective • Remember that science is a body of knowledge AND a process. • Scientific facts noted in your textbook (published in 2008), may have been replaced or rejected due to discoveries after the date of publication. • There are still many unknowns in science that have yet to be discovered. • Name and describe a branch of science and describe how it overlaps with another area.
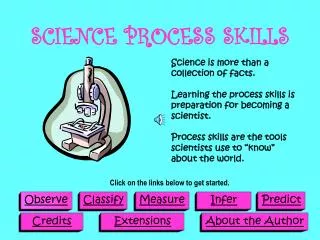
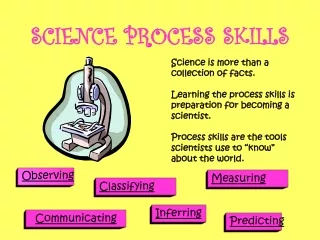
1-2 Using a Scientific Approach • Scientific Methods
The goal of any scientific method is to solve a problem or to better understand an observed event.
Making Observations • Observing Light Activity • Does the bulb radiate light in all directions? • What happens to the bulb’s brightness as the distance from the bulb increases? • Is an observation required in order for you to arrive at a question? • Forming a Hypothesis What is a hypothesis? • Testing a Hypothesis Variable-any factor that can change in an experiment Manipulated variable Responding variable Controlled experiment • Drawing Conclusions Use the results (qualitative and quantitative data) to develop your conclusion/ • Developing a Theory • A theory can be developed if a hypothesis is supported after repeated experiments.
Scientific Laws • A SCIENTIFIC LAW DESCRIBES AN OBSERVED PATTERN IN NATURE WITHOUT ATTEMPTING TO EXPLAIN IT. • THE EXPLANATION OF SUCH A PATTERN IS PROVIDED BY A SCIENTIFIC THEORY. • How are scientific laws affected by new scientific theories? • If a scientific law were developed in one country, would it apply in a different county? Explain.
Scientific Models • Scientific models make it easier to understand things that might be too difficult to observe directly. • Flaps on an Airplane Demo • What is a model?
Working Safely in Science • Most important rule…. • ALWAYS follow you teacher’s instructions and the textbook/lab directions exactly! • When in doubt, ASK! • ALWAYS wash your hands after every scientific activity. What safety measures are these scientists taking in their lab work? Why are these scientists wearing goggles?
Using Scientific Notation • Since scientists work with very large and very small numbers, scientific notation allows them to avoid writing all the zeros that would otherwise be needed. Scientific notation makes numbers easier to work with. • For example: • The number 300,000,000 can be written as the product of a number between 1 and 10 and a power of 10. • The number 0.00086 can also be written as the product of a number between 1 and 10 and a power of 10. Would it be easy to count the number of stars shown in the photo on the left? Why might using scientific notation be appropriate when counting the number of stars?
SI Units of MeasurementScientists use a set of measuring units of called SI, or the International System of Units. • Base Units and Derived Units SI is based on 7 metric units called base units. Derived units are a combination of base units. Example: The quantity of density requires derived units.
Metric Conversions • Sometimes the given unit of measure is not convenient to work with. • Examples: • The easiest way to convert units is to use a conversion factor. • Suppose you are asked to convert 8848 meters (the height of Mount Everest) into kilometers. • Two possible conversion factors:
Investigation: • Conversion Factor Demo
Metric Prefixes • What factor are the metric prefixes based on? • How does that make it convenient for converting between units?
Limits of Measurement • Precision – a gauge of how exact a measurement is analog clock, digital clock, stop watch • Accuracy Significant figures are the digits that are known in measurement plus the last digit that is estimated • 5 seconds = 1 sig figure • 5.25 seconds = 3 sig figures • The fewer the sig figures, the less precise • Calculated Measurements: limited by the lease precise measurement used in the calculation • What is accuracy?
Measuring Temperature Thermometers measure how hot an object is.
Three measurement scales: Conversion formulas between scales: Let’s practice!
Investigations: • Determining the Thickness of Aluminum Foil • Evaluating Precision • Measuring Volume and Temperature
1-4 Presenting Scientific Data • Organizing Data • Data Tables – the simplest way to organize data
Line Graphs – show changes that occur in related variables “Rise represents the change in the y- variable. In an inverse proportion, the product of two variables “Run represents the corresponding change in the remains constant. Each point on the graph above x-variable. The mass and volume are in direct represents the same volume of water: 1 gallon. proportion. 1. What is the volume of 3 g of water? 2. What is the mass of 9 cm of water? 3. What do you think the mass of 15 of water would be? 4. At a flow rate of 3.5 gallons per minute, how long would it take to fill a 1-gallon pot with water? 5. Why is a line graph more useful than a data table for akin inferences or estimates like this?
Bar Graphs – used to compare a set of measurements, amounts or changes On the bar graph, which pairs of cities have similar annual precipitation? • Circle Graphs – shows how a part or share of something relates to the whole
Communicating DATa • Scientists can communicate results by writing in scientific journals, speaking at conferences, through conversations, e-mails and Web sites. • At a science fair, students communicate what knowledge they have gained by using scientific methods. • These opportunities are important because… • different scientists may interpret the same data differently • peer review provides comments, suggestions, questions and criticisms • peer review provides accountability (check for accuracy and honesty)