Download
1 / 49
500 likes | 880 Vues
Studying place effects on health by synthesising individual and area-level outcomes using a new class of multilevel models. Nicky Best, Chris Jackson, Sylvia Richardson Department of Epidemiology and Public Health Imperial College, London. http://www.bias-project.org.uk. Outline.

E N D
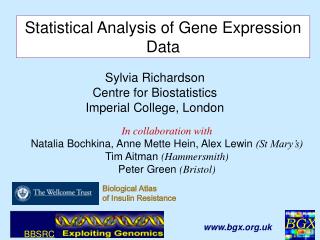
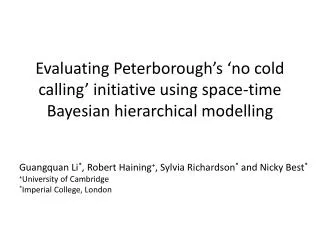
Studying place effects on health by synthesising individual and area-level outcomes using a new class of multilevel models Nicky Best, Chris Jackson, Sylvia Richardson Department of Epidemiology and Public Health Imperial College, London http://www.bias-project.org.uk
Outline • Introduction and motivating example • Models for analysing individual and contextual effects • Standard multilevel model • Ecological regression • Hierarchical related regression • Concluding remarks
BIAS project: Overall goals • To develop a set of statistical frameworks for combining data from multiple sources • To improve our capacity to handle biases inherent in the analysis of observational data. • Key statistical tools: Bayesian hierarchical models and ideas from graphical models form the basic building blocks for these developments
Example: Socioeconomic predictors of health Question • Characterising individual level socio-demographic predictors of limiting long term illness (LLTI) and heart disease • Is there evidence of contextual effects? Design Data synthesis using • Individual-level survey data: Health Survey for England. • Area-level administrative data: Census small-area statistics and Hospital Episode Statistics Methodological issues • Sparse individual data per area (0-9 subjects per area) so difficult to estimate contextual effects • Can’t separate individual and contextual effects using only aggregate data (ecological bias) • Improve power and reduce bias by combining data
Target analysis Individual outcome xij yij Individual exposure Aggregate exposure Zi, Xi Zi, Xi Zi, Xi Ecological regression Aggregate outcome Aggregate exposure Yi Hierarchical Related Regression (HRR) Individual outcome xij yij Individual exposure Aggregate outcome Aggregate exposure Yi
Multilevel model for individual data b g s2 ai xij yij Zi person j area i
Multilevel model for individual data yij ~ Bernoulli(pij), person j, area i b g s2 logit pij = ai + b xij + g Zi ai xij yij Zi person j area i
Multilevel model for individual data yij ~ Bernoulli(pij), person j, area i b g s2 logit pij = ai + b xij + g Zi ai ai ~ Normal(0, s2) xij yij Zi person j area i
Multilevel model for individual data yij ~ Bernoulli(pij), person j, area i b g s2 logit pij = ai + b xij + g Zi ai ai ~ Normal(0, s2) xij yij Zi Weak priors on s2, b, g person j area i
Multilevel model for individual data yij ~ Bernoulli(pij), person j, area i b g s2 logit pij = ai + b xij + g Zi ai ai ~ Normal(0, s2) xij yij Zi Weak priors on s2, b, g b = individual-level effects g = contextual effects ai = “unexplained” area effects person j area i
Health outcomes Individual predictors Contextual effect Ward codes made available under special license Data sources INDIVIDUAL DATA Health Survey for England • Self-reported limiting long term illness • Self reported hospitalisation for heart disease • age and sex • ethnicity • social class • car access • income • etc. AREA (WARD) DATA Census small area statistics • Carstairs deprivation index
Univariate regression Area deprivation Multiple regression Area deprivation No car Social class IV/V Non white Results from analysis of individual survey data: Heart Disease (n=5226)
Univariate regression Area deprivation Multiple regression Area deprivation Female Non white Doubled income Results from analysis of individual survey data: Limiting Long Term Illness (n=1155)
Comments • CI wide and not significant for most effects • Some evidence of contextual effect of area deprivation for both heart disease and LLTI • Adjusting for individual risk factors (compositional effects) appears to explain contextual effect for heart disease • Unclear whether contextual effect remains for LLTI after adjustment for individual factors • Survey data lack power to provide reliable answers about contextual effects • What can we learn from aggregate data?
Contextual effect Aggregate health outcomes Aggregate versions of individual predictors Area-level data AREA (WARD) DATA Census small area statistics • Carstairs deprivation index • population count by age and sex • proportion reporting LLTI • proportion non-white • proportion in social class IV/V • proportion with no car access PayCheck (CACI) • mean & variance of household income Hospital Episode Statistics • number of admissions for heart disease
Standard ecological model: Yi ~ Binomial(qi, Ni); logit(qi) = ai + b Xi + c Zi Yi is the number of disease cases in area i Ni is the population in area i Xi is the mean of xij in area i qi is the area-specific risk of disease • exp(b) = odds ratio associated with mean exposure Xi Ecological inference • This is the group level association. Not necessarily equal to individual-level association i.e. b ≠ b→ ecological bias
Xi Standard ecological regression model c b s2 ai Zi Yi Ni area i
Yi ~ Binomial(qi,Ni), area i Xi Standard ecological regression model c b s2 logit qi = ai + bXi + cZi ai Zi Yi Ni area i
Yi ~ Binomial(qi,Ni), area i Xi Standard ecological regression model Yi ~ Binomial(qi,Ni), area i c b s2 logit qi = ai + bXi + cZi ai ai ~ Normal(0, s2) Zi Yi Ni area i
Yi ~ Binomial(qi,Ni), area i Xi Standard ecological regression model Yi ~ Binomial(qi,Ni), area i c b s2 logit qi = ai + bXi + cZi ai ai ~ Normal(0, s2) Zi Yi Priors on s2, b, c Ni area i
Comparison of individual and ecological regressions: Heart Disease Individual Area deprivation Ecological No car Social class IV/V Non white
Comparison of individual and ecological regressions: Limiting Long Term Illness Individual Area deprivation Ecological Female Non white Doubled income
Ecological bias Bias in ecological studies can be caused by: • Confounding • confounders can be area-level (between-area) or individual-level (within-area). • Solution: try to account for confounders in model • Non-linear exposure-response relationship, combined with within-area variability of exposure • No bias if exposure is constant in area (contextual effect) • Bias increases as within-area variability increases • …unless models are refined to account for this hidden variability
Improving ecological inference • Alleviate bias associated with within-area exposure variability. • Obtain information on within-area distribution fi(x)of exposures, e.g. from individual-level exposure data. • Use this to form well-specified model for ecological data by integrating (averaging) the underlying individual-level model. Yi ~ Binomial(qi , Ni);qi = pij(x) fi(x) dx qi is average group-level risk pij(x) is individual-level risk given covariates x fi(x) is distribution of exposure x within area i(or joint distribution of multiple exposures)
Integrated group-level model Xi = proportion exposed in area i (mean of xij) qi = average risk (prevalence) of disease in area i = ∑j pij /Ni = ea (1-Xi) + ea+b Xi • For multiple covariates, need information on joint within-area distribution (not just marginal X’s) Improving ecological inference • Suppose we have single binary covariate x • Individual-level model log pij = a + b xij(log link assumed for simplicity) → pij = ea if person j is unexposed (xij=0) pij = ea+b if person j is exposed (xij=1)
Xi Standard ecological regression model Yi ~ Binomial(qi,Ni), area i c b s2 logit qi = ai + bXi + cZi ai ai ~ Normal(0, s2) Zi Yi Priors on s2, b, c Ni area i
Xi Integrated ecological regression model Yi ~ Binomial(qi,Ni), area i g b s2 qi = pij(xij,Zi,ai,b,g)fi(x)dx ai ai ~ Normal(0, s2) Zi Yi Priors on s2, b, g Ni area i
Xi Combining individual and aggregate data Multilevel model for individual data Integrated ecological model b g g s2 b s2 ai ai xij Zi yij Yi Zi person j Ni area i area i
Xi Combining individual and aggregate data b g s2 Hierarchical Related Regression (HRR) model Joint likelihood for yij and Yi depending on shared parameters b, g, s2 ai xij yij Zi Yi person j Ni area i
Xi Extending HRR model to multiple covariates b g s2 ai xij yij Zi Yi person j Ni area i
Xi1 XiQ Extending HRR model to multiple covariates b g s2 ai xij1 yij Zi Yi xijQ person j Ni area i
XiQ Xi1 Extending HRR model to multiple covariates b g s2 district d person k xdk1 xdkQ ai fi xij1 yij Zi Yi xijQ person j Ni area i
Extending HRR model to multiple covariates • Suppose x1…xQ are all binary variables • R = 2Q possible combinations • fi = [fi1,…, fiR] where fir is probability that individual in area i has covariate combination r (r=1,…,R) • We estimate fi using Q-way cross-tabulation of covariates in district d(i) from Sample of Anonymised Records (SAR)….. • ……with constraint that marginal probabilities for each covariate match observed ward proportions from Census • Assumes within-district correlations are representative of within-ward correlations for all wards in a district
Combined data INDIVIDUAL DATA Health Survey for England • health outcomes and covariates • ward code available under special license AREA (WARD) DATA Census small area statistics PayCheck (CACI) Hospital Episode Statistics • aggregate health outcomes • aggregate covariates (marginal) Sample of Anoymised Records (SAR) • 2% sample of individual data from Census • district code available • provides estimate of within-area distribution of covariates assume same distribution for all wards within a district
Comparison of results from different regression models: Heart Disease Individual Area deprivation Standard ecological Integrated ecological No car HRR Social class IV/V Non white
Comparison of results from different regression models: Limiting Long Term Illness Individual Area deprivation Standard ecological Integrated ecological Female HRR Non white Doubled income
Unexplained area variability in risk • Random effects account for unexplained differences in risk between areas, after accounting for observed covariates • Large variance s2→ large unexplained differences • Median odds ratio (Larsen & Merlo 2005) is a simple transformation of s2 to scale of odds ratio • MOR = exp( √2sF-1(0.75) ) • MOR = median of the residual odds ratios over all pairs of areas • Directly comparable to odds ratio for an observed covariate
Unexplained area variability in risk of Heart Disease Area deprivation Individual HRR No car Social class IV/V Non white MOR
Unexplained area variability in risk of LLTI Area deprivation Individual HRR Female Non white Doubled income MOR
Comments • Integrated ecological model yields odds ratios that are consistent with individual level estimates from survey • Large gains in precision achieved by using aggregate data • Significant contextual effect of area deprivation for LLTI but not heart disease • For LLTI, unexplained area variation is small compared to that explained by deprivation (MOR=1.2, deprivation OR=2.6) • For heart disease, there is more unexplained area variation (MOR=1.5)
Comments • Little difference between estimates based on aggregate data alone and combined individual + aggregate data • Individual sample size very small (~0.1% of population represented by aggregate data) • In other applications with larger individual sample sizes and/or less informative aggregate data, combined HRR model yields greater improvements (see simulation study) • Care needed to check consistency between data sources
True Log RR % exposed: 0-25% (100 areas) Individual data Area data Area data + sample of 10 individuals % exposed: 0-50% (100 areas) % exposed: 0-100% (100 areas) % exposed: 0-25% (25 areas) Log RR of IHD for smokers Simulation Study log RR of disease for exposed whites
Are aggregate and individual data consistent? Health Survey for England aggregated over areas 1991 Census
Are aggregate and individual data consistent? • LLTI • Health Survey for England: 23% • Census: 13% • Similar discrepancies noted by other authors • May reflect differences between interview and self-completed surveys • Remedy: include fixed offset in regression model for Census data
Aggregate data can be used for individual level inference if appropriate integrated model is used • requires large exposure contrasts between areas • requires information on within-area distribution of covariates • Combining samples of individual data with administrative data can yield improved inference • improves ability to investigate contextual effects • increase statistical power compared to analysis of survey data alone • requires geographical identifiers for individual data • Important to check compatibility of different data sources when combining data • Important to explore sensitivity to different model assumptions and data sources
Jackson C, Best N and Richardson S. (2008) Studying place effects on health by synthesising individual and area-level outcomes. Social Science and Medicine, to appear. Papers available from www.bias-project.org.uk Thank you for your attention!