Download
1 / 62
620 likes | 745 Vues
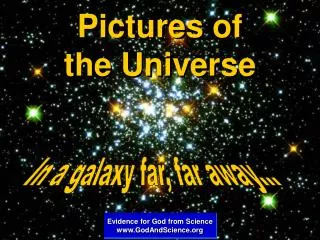
The HI gas content of galaxies around Abell 370, a galaxy cluster at z = 0.37. Philip Lah. International SKA Forum 2010 . A New Golden Age for Radio Astronomy.

E N D
The HI gas content of galaxies around Abell 370, a galaxy cluster at z = 0.37 Philip Lah International SKA Forum 2010 A New Golden Age for Radio Astronomy
Collaborators:Frank Briggs (ANU)Michael Pracy (Swinburne) Jayaram Chengalur (NCRA) Matthew Colless (AAO)Roberto De Propris (CTIO)
Method: Coadding the HI signals from distant galaxies using the galaxies’ known optical positions and redshifts
Giant Metrewave Radio Telescope Anglo-Australian Telescope Australia India
Nearby Galaxy Clusters Are Deficient in HI Gas The Coma Cluster
The Butcher-Oemler Effect Blue Fraction, fB Redshift, z
The Butcher-Oemler Effect Abell 370 Blue Fraction, fB Redshift, z
Abell 370, a galaxy cluster at z = 0.37 • large galaxy cluster of order same size as Coma • similar cluster velocity dispersion and X-ray gas temperature GMRT ~34 hours on cluster • optical imaging • ANU 40 inchtelescope • spectroscopic follow-up with the AAT Abell 370 cluster core, ESO VLT image
redshift histogram 324 useful redshifts from AAT observations
redshift histogram 324 useful redshifts from AAT observations GMRT sideband frequency limits
Abell 370 galaxy cluster Abell 370 galaxy cluster 324 galaxies 105 blue (B-V 0.57) 219 red (B-V > 0.57)
Abell 370 galaxy cluster Abell 370 galaxy cluster 3σ extent of X-ray gas R200 radius at which cluster 200 times denser than the general field
HI mass 324 galaxies 219 galaxies 105 galaxies Inner Regions Outer Regions 94 galaxies 156 galaxies The galaxies around Abell 370 are a mixture of early and late types in a variety of environments. 168 galaxies 110 galaxies 214 galaxies
HI mass 324 galaxies 219 galaxies 105 galaxies 94 galaxies 156 galaxies 168 galaxies 110 galaxies 214 galaxies
HI mass 324 galaxies 219 galaxies 105 galaxies 94 galaxies 156 galaxies 11 blue galaxies within intra-cluster hot x-ray gas appearHI deficient 168 galaxies 110 galaxies 214 galaxies
HI mass 324 galaxies 219 galaxies 105 galaxies 94 galaxies 156 galaxies 168 galaxies 110 galaxies 214 galaxies
HI mass 324 galaxies 219 galaxies 105 galaxies 94 galaxies 156 galaxies 168 galaxies 110 galaxies 214 galaxies
Distribution of galaxies around Abell 370 cluster redshift complete GMRT redshift range
HI density Whole Redshift Region z = 0.35 to 0.39 Outer Cluster Region Inner Cluster Region
Distribution of galaxies around Abell 370 cluster redshift
Distribution of galaxies around Abell 370 8 Mpc radius region cluster redshift
HI density Whole Redshift Region z = 0.35 to 0.39 Outer Cluster Region Inner Cluster Region
Distribution of galaxies around Abell 370 cluster redshift
Distribution of galaxies around Abell 370 cluster redshift within R200 region
HI density Whole Redshift Region z = 0.35 to 0.39 Outer Cluster Region Inner Cluster Region
HI Mass to Light Ratios HI mass to optical B band luminosity for Abell 370 galaxies Uppsala General Catalog Local Super Cluster (Roberts & Haynes 1994)
HI Mass to Light Ratios HI mass to optical B band luminosity for Abell 370 galaxies Uppsala General Catalog Local Super Cluster (Roberts & Haynes 1994)
Galaxy HI Mass vs Star Formation Rate HIPASS & IRAS data z ~ 0 Doyle & Drinkwater 2006
HI Mass vs Star Formation Rate in Abell 370 all 168 [OII] emission galaxies Average line from Doyle & Drinkwater 2006
HI Mass vs Star Formation Rate in Abell 370 81 blue [OII] emission galaxies Average line from Doyle & Drinkwater 2006 87 red [OII] emission galaxies
Star Formation Rate from[OII] Emissionand Radio Continuum Emission
Radio Continuum vs. [OII] Star Formation Rate Average all 168 [OII] emission galaxies line from Bell 2003
Radio Continuum vs. [OII] Star Formation Rate Average 87 red [OII] emission galaxies 81 blue [OII] emission galaxies line from Bell 2003
Conclusion • Abell 370, a galaxy cluster at redshift z = 0.37 (~4 billion years ago) contains significantly more HI gas than observedin similar nearby clusters • however the galaxies in regions of higher density within Abell 370 have less gas than galaxies located in regions of lower density, the same trend seen in nearby galaxy clusters • despite their high HI mass the galaxies around Abell 370 appear normal; they have HI Mass to Light Ratio and a Star Formation Rate to HI Gas correlation similar to that seen in nearby galaxies Paper: Lah et al. 2009 MNRAS.399.1447L
Conclusion • Abell 370, a galaxy cluster at redshift z = 0.37 (~4 billion years ago) contains significantly more HI gas than observedin similar nearby clusters • however the galaxies in regions of higher density within Abell 370 have less gas than galaxies located in regions of lower density, the same trend seen in nearby galaxy clusters • despite their high HI mass the galaxies around Abell 370 appear normal; they have HI Mass to Light Ratio and a Star Formation Rate to HI Gas correlation similar to that seen in nearby galaxies Paper: Lah et al. 2009 MNRAS.399.1447L
Conclusion • Abell 370, a galaxy cluster at redshift z = 0.37 (~4 billion years ago) contains significantly more HI gas than observedin similar nearby clusters • however the galaxies in regions of higher density within Abell 370 have less gas than galaxies located in regions of lower density, the same trend seen in nearby galaxy clusters • despite their high HI mass the galaxies around Abell 370 appear normal; they have HI Mass to Light Ratio and a Star Formation Rate to HI Gas correlation similar to that seen in nearby galaxies Paper: Lah et al. 2009 MNRAS.399.1447L
SKA pathfinders For the Future The SKA pathfinders ASKAP and MeerKAT can measure the HI 21-cm emission from galaxies out to redshift z = 1.0using the coadding technique with existing optical redshift surveys.
Abell 370 – R band images Thumbnails 10’’ sq 324 galaxies with useful redshifts (z~0.37) Ordered by observed R band magnitudes