Feedback at High Redshift
980 likes | 1.19k Vues
Feedback at High Redshift. Alice Shapley (UC Berkeley) May 4th, 2004. Overview and Motivation. Importance of feedback Observations at z~3: winds and ionizing radiation Observations at z~2: more winds, the smoking gun What’s next: morphologies, ages, masses, z~1

Feedback at High Redshift
E N D
Presentation Transcript
Feedback at High Redshift Alice Shapley (UC Berkeley) May 4th, 2004
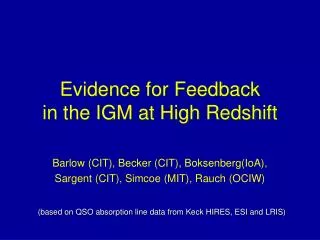
Overview and Motivation • Importance of feedback • Observations at z~3: winds and ionizing radiation • Observations at z~2: more winds, the smoking gun • What’s next: morphologies, ages, masses, z~1 • High-res QSO spectra plus large galaxy samples serve as a powerful tool for understanding feedback during an important epoch of the Universe’s history
Schematic model of superwinds • Collective effect of multiple SNe: mechanical energy input causes shock-heated expanding superbubble with T~108 K, expands, entrains cold ISM • Superwind seen in local starbursts with S>0.1 Msun/year/kpc2 • (Heckman et al. 1990, Heckman 2002)
Outflows: Local Starbursts • M82 • Nearby starburst galaxy • Red is Ha emission from ionized gas above the plane of the galaxy • outflow speed: >500 km/s • plenty of detailed spatial information • (Subaru Image)
Importance of feedback/outflows • Enrichment and heating of IGM • Enrichment and entropy floor in ICM • Problems in models of galaxy formation: overcooling and angular momentum • Feedback often invoked as solution, but crudely modeled in both semi-analytic and numerical codes • Observationally important to constrain mass, energy, metals escaping, and how these depend on galaxy properties
Typical L* LBG Spectrum Unsmoothed Smoothed by 5 pix RAB=24-25.5 1.5 hr exposure S/N ~ 2/pix, 9-12 AA resolution
Evidence for outflows in spectra • Velocity offsets (em-abs) • Redshifted Lya • Blueshifted IS abs • Avg offset is 650 km s-1 (Dz=0.008) outflow • Stellar photospheric features are too weak to detect, so we need to guess what the systemic redshift is • (Shapley et al. 2003)
Total LBG Composite Spectrum • Features • UV cont: O & B stars • Stellar: photospheric and wind • Outflow-related: Lya (Dv=+360), low and high ions (Dv=-170) • Nebular emission • Fine-structure emission • (Shapley et al. 2003)
Empirical Outflow Results • Stronger Lya • Bluer UV continuum • Weaker low-ion absorption • Smaller Dv(em-abs) • Dependence of low- and high-ions decoupled
z~3 Galaxy/IGM Connection • 8 fields with QSOs at z~3.5 • Survey galaxies and Lya forest in same cosmic volume • Determine relative distributions of galaxies, HI, metals • (Adelberger et al. 2003) Unsmoothed
z~3 Galaxy/IGM Connection less HI more HI Deficit of HI near LBGs and strong LBG/CIV cross-correlation function (Adelberger et al. 2003)
A Physical Picture Outflows of neutral and ionized gas: different neutral and ionized covering fractions? Hotter gas we don’t see What radius?
A Physical Picture Dust: UV extinction in outflow Outflow geometry vs. what is seen in local superwinds
A Physical Picture Effect on IGM: Gal/IGM correlations --> Expected sphere of influence: 180 kpc (0.5-1 comoving Mpc) Vwind >= vesc
The Search for Lyman-Continuum Emission • Ionizing background: important for understanding reionization and Lya forest props; measured with QSO “proximity effect” • Question: relative contribution of QSOs & gals vs. z??? (drop-off in QSO number density at high redshift) • Lyman-Continuum Observations of Galaxies • z~0: HUT spectra at z~0, fesc<0.01-0.15 (Leitherer et al.) • z=1.1-1.7:HST/STIS UV imaging, fesc <0.002 (Malkan et al.) • z~3: LBG composite spectrum, fesc~0.10 (Steidel et al.) • Controversy at z~3!! • HST/WFPC2 UBVi colors, fesc <0.039 (Fernandez-Soto et al.) • VLT spectra of 2 gals, fesc<0.01 (Giallongo et al. 2002)
Detection of Ly-C Emission? • Lyman Cont. Leakage • 29 gals at <z>=3.4+/-0.09 • Significant Ly-cont flux in composite spectrum 5 times more ionizing flux than QSOs at z~3 • Bluest quartile in (G-R)0, strong Lya emission, IS abs lines weaker than cB58: is it representative? • fesc different from local SB (Leitherer et al. 1995) (Steidel et al. 2001)
The Search for Lyman-Continuum Emission • Ionizing background: important for understanding reionization and Lya forest props; measured with QSO “proximity effect” • Question: relative contribution of QSOs & gals vs. z??? (drop-off in QSO number density at high redshift) • Ly-C Observations of Galaxies • z~0: HUT spectra at z~0, fesc<0.01-0.15 (Leitherer et al.) • z=1.1-1.7:HST/STIS UV imaging, fesc <0.002 (Malkan et al.) • z~3: LBG composite spectrum, fesc~0.10 (Steidel et al.) • Controversy at z~3!! • HST/WFPC2 UBVi colors, fesc <0.039 (Fernandez-Soto et al.) • VLT spectra of 2 gals, fesc<0.01 (Giallongo et al. 2002)
New Ly-C Observations • Spectra with 18+ hours of exp time for a sample of ~15 objects • Red side: detailed observations of interstellar lines • Blue side: sensitive observations of Lyman Continuum region • Overcome some of the limitations of composite spectra • Observations approach the quality of cB58, but larger sample • We may detect Ly-C emission for an individual object!
2” SSA22a-D3 z=3.07 Rs=23.37 P200 Rs HST/NICMOS F160W
Lyman limit, 912 AA Lya 3710 AA 4950 AA SSA22a-D3 z=3.07 Rs=23.37 HST/NIC F160W Keck/LRIS-B, 8 hours Red side: strong abs lines Blue side: Lya to atm cutoff D3 is double, and upper brighter component appears to have significant flux below 912 AA
SSA22a-D3 z=3.07 Rs=23.37 HST/NIC F160W Lyb Ly-C Lya Apparent detection of flux at rest-frame 880-912 AA (S/N~7). Other pair member is undetected.
SSA22a-D3 z=3.07 Rs=23.37 HST/NIC F160W Lyb Ly-C Lya D3 is only object with apparent Ly-C flux out of 15 on mask. Why is it special?
Evolution of the Lya Forest • dn/dz governed by balance between ionizing bg (ionization) and Hubble expansion (recombination) • At 1.5<z<4, dn/dz~(1+z)2.47 • At lower-z, dn/dz shallower (decrease in QSO density) (Kim et al. 2002)
z>2 color-selection • Adjust z~3 UGR crit. for z~2 (Adelberger et al. 2004) • Spectroscopic follow-up with optimized UV-sensitive setup (Keck I/LRIS-B) (Steidel et al. 2004)
Redshift Distributions LBG: z~3 (940) BX: z=2-2.5 (749) BM: z=1.5-2.0 (107) 700 gals at z=1.4-2.5 5/7 survey fields contain bright bg QSOs (Steidel et al. 2004) Unsmoothed
Evidence for outflows in spectra • Outflow kinematics • Lya em at systematically higher redshift than IS abs • observed in both z~2 and z~3 LBGs • part of the gal/IGM connection
z~3 vs. z~2 outflow kinematics • v=0 from rest-frame optical nebular emission lines: [OIII] at z~3 and Ha at z~2 • ISM kinematics similar at z~3 and z~2 • Typical velocities are 200-400 km/s wrt nebular emission lines • D(Lya-abs)=500-1000 km/s • (Steidel et al. 2004) z~3 z~2 Unsmoothed
z~2 Galaxy/IGM Connection • Much higher galaxy surface density (factor of 4 higher per unit solid angle) • Further explore use of galaxy spectra to probe IGM • Forest evolves extremely rapidly over the redshift range 3.51.8: how does the galaxy/forest relationship change? • Many more QSO sightlines • 17 lines of sight in 5 fields • Simultaneously obtain first extensive information on z~2 galaxies. • Epoch of peak star formation and black hole growth? • Redshifts z=1.9-2.6 are ideal for near-IR spectroscopic follow-up
Q1623: QSOs, gals at z=1.8-2.5 7 QSO probes (HIRES/ESI/LRIS-B spectra) in 16’ by 12’ field
z~2 Galaxy Proximity Effect? z~2: 22 gals w/in 0.8h-1 comoving Mpc of QSO sightline Less HI More HI Less HI z~2 z~3 More HI (yellow:Adelberger et al. 2004, blue:simulations by Kollmeier and Weinberg)
Q2343-BX587 • Bright bg QSO: z=2.52 • BX587: z=2.24, R=24, Ks=20.3, D=115 kpc • Blue circles have 30”/60” (235/470 kpc) The “Smoking Gun” Direct association between gals and broad OVI, NV, CIV
zgal The “Smoking Gun” • Galaxy Spectra • ∆(vneb-vism) = 460 km/s • O/H~solar • SFR~85 Msun/yr, M*~6 x 10¹⁰ Msun D=115 kpc • HIRES QSO Spectrum • ∆v(CIV,NV)~570 km/s (wind: shock-heated and then cooling) • Weak associated Ly
The “Smoking Gun”: OVI v=0 is zgal Z=2.44 Z=2.32 OVI (Simcoe et al. 2002) Galaxy: BX717 z=2.4353 D=218 kpc Galaxy: MD103 z=2.3148 D=115 kpc Q1700: Direct association between gals and OVI absorption!
Future Directions • Data Higher spectral resolution obs of strong absorption lines Outflows vs. opt/IR colors (age, stellar mass) • Outflows vs. Ly-C leakage (vs. covering fraction) • Outflows vs. chemical abundance • Galaxy/galaxy pairs, spatially distinct probes of outflows • Outflow vs. morphology (HST/ACS) • Extend similar studies down to z~1 (HST/FOS) • Simulations • What physical state of galaxies determines conditions in outflow? What is geometry of different phases of outflow? How much mass, energy, metals escape?
Spectra vs. Morphology • Combine Morphological and spectral information: • --> extended disk-like, merger, compact • --> Lya em/abs, low- and high-ionization abs • Attempt to obtain spatial/geometric information about outflows (along with pairs) • 240 UV-selected galaxies at z>1.4 in GOODS/ACS • -->multi-wave: x-ray, radio, submm, Spitzer • 50 z~3 galaxies in SSA22a field with GDDS/ACS
Spectra vs. Morphology Keck/LRIS-B spectrum HST/ACS Bviz z=2.05; RAB=23.38 4”
Spectra vs. Morphology Keck/LRIS-B spectrum HST/ACS Bviz z=2.22; RAB=23.28 4”
Spectra vs. Morphology Keck/LRIS-B spectrum HST/ACS Bviz z=2.23; RAB=23.50 4”
A Special Case: The Pair at z=1.60/2.17 BX201 z=2.17 Keck/ LRIS spectra 3800-4100 AA BM115 z=1.60 HST/WFPC2 F814W image Dq =2” 11 h-1 kpc at z=1.6 • Two UV-selected z~2 galaxies on one slit • Higher z galaxy probes outflow of lower-z gal at 11h-1 kpc • Outflowing gas: velocity & abs strength difference vs. radius
Examples of Deep LBG Spectra • LRIS-R spectra (LRIS-B covers Lya and Lyman continuum) • Use these spectra to measure physical properties of abs. lines; connect with UV-color, Lya, Lyman continuum • Obtain complete data set: near-IR imaging (ages) and spectra (O/H), morphologies
Summary • Evidence for SNe feedback & its effect on IGM at z~2-3 • Possible detection of Ly-Cont radiation at z~3 • Next step: determine detailed properties of galaxies sustaining superwinds: morphologies, ages, masses, geometry (how much mass and energy are involved? What determines appearance of spectra/outflow?) • Combining deep spectroscopic observations with deep ACS images will provide great insight into the nature of feedback, when star-formation, stellar mass build-up, AGN activity were most active in the Universe.
Morphology vs. Outflow props • Use ACS BViz images of GOODS-N field, in which there are 240 galaxies with z>1.4 • Connect morph and spectroscopic outflow props: extended disk-like, merger, compact • Ind. and avg. Galaxies at z=2.1-2.5
Spectra vs. Morphology Keck/LRIS-B spectrum HST/ACS Bviz z=2.22; RAB=23.22 4”
Spectra vs. Morphology Keck/LRIS-B spectrum HST/ACS Bviz z=2.22; RAB=23.22 4”
Spectra vs. Morphology Keck/LRIS-B spectrum HST/ACS Bviz z=2.55; RAB=23.29 4”
Spectra vs. Morphology Keck/LRIS-B spectrum HST/ACS Bviz z=2.10; RAB=23.24 4”