Download
1 / 28
280 likes | 301 Vues
Explore a teaching sequence using matrix theory to study Belgian population trends, including calculations with data, matrix models, and observations on long-term population shifts. Discover the mathematical treatment of these observations.

E N D
Modelling the evolution of the Belgian population, eigenvalues and eigenvectors Johan Deprez ICTMA-14, Hamburg, July 2009 www.ua.ac.be/johan.deprez
teacher educator (future) mathematics teachers in upper secondary school 10 years of experience now about half-time mathematics teacher tertiary education introductory mathematics course for Bachelor students in applied economics 20 years of experience now about half-time About myself researcher: only for a small part of my professional time
A teaching sequence, incl. experiences in different contexts model for evolution of the Belgian population which serves as an introduction to the mathematical theory of matrices, eigenvalues and eigenvectors used in different contexts: • in my own teaching of mathematics • in my mathematics teacher education course • during the ‘Science Week’ with secondary school students
Content of the talk • Teaching sequence • Calculations with authentic data • The matrix model • Two observations concerning the long term evolution of the population • Mathematical treatment of the observations • Eigenvalues and eigenvectors • Experiences with the teaching sequence in different contexts • during Science Week • in teacher education • in my own mathematics teaching • The model of the Belgian statistical institute
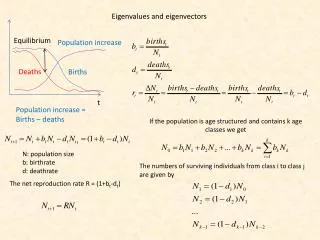
Teaching sequence: 1. Calculations with authentic data population by age and sex data from the Belgian national statistics institute fertility rates survival rates I don’t use data concerning migration!
Teaching sequence: 1. Calculations with authentic data Questions like: • How many men of age 35 on 1st Jan. 2003? • How many women of age 35 on 1st Jan. 2010? • How many births in 2003? How many boys/girls? • How many boys of age 3 on 1st Jan. 2010? Students are aware of assumptions/simplifications: • constant survival and fertility rates • (no migration) Calculations become messy!
Teaching sequence: 2. The matrix model Simplified data: • age groups of 20 years • male+female • rounded to 2 decimals based on the NIS-data (not trivial!) a little bit manipulated... (to obtain a nice eigenvalue) rates over periods of 20 years! important consequence: you can calculate the evolution of the population in steps of 20 years only! Calculations are no longer messy if you work recursively: • first calculate the population in 2023 • then calculate the population in 2043 • ...
Teaching sequence: 2. The matrix model number in I in 2023: number in II in 2023: number in III in 2023: number in IV in 2023: number in V in 2023: This calculation corresponds to a matrix calculation! 2003 2023
Teaching sequence: 2. The matrix model population 1st Jan. 2003 fertility rates Leslie matrix survival rates in general: population in 2023: population in 2043: assumptions/simplifications: we use the same fertility and survival rates in every step, no migration, ...
Teaching sequence: 3. Two observations concerning the long term evolution babyboom long term: graphs of all age groups show a common regularity babyboom formula describing the regularity? ‘short’ term: chaos babyboom Does it make sense to study the long term evolution? It does, in my opinion...
Teaching sequence: 3. Two observations concerning the long term evolution -15.7% -16.1%
Teaching sequence: 3. Two observations concerning the long term evolution 1st observation: In the long run, the number of individuals in each age group decreases by 16% per period of 20 years, i.e. the number in each age group decays exponentially with growth rate 0.84 (= the long term growth rate).
Teaching sequence: 3. Two observations concerning the long term evolution long term age distribution (LT = long term) 2nd observation: in the long run the age distribution stabilizes
Teaching sequence: 4. Mathematical treatment of the observations Central question: How can you calculate the long term growth rate and the long term age distribution in a ‘mathematical’ way?
Teaching sequence: 4. Mathematical treatment of the observations 1st observation (long term growth factor): in the long run: X(n) 0.84·X(n-1), or: X(n+1) 0.84·X(n) hence: L·X(n) 0.84·X(n) for large n and the approximation improves indefinitely if n increases indefinitely 2nd observation (long term age distribution): LT age distribution: (where t(n) is the total population after n periods)
Teaching sequence: 4. Mathematical treatment of the observations Combination of the two observations: Mathematical calculation of LT age distribution if the long term growth factor is known: (1) LT age distribution X is a solution of the system L·X = 0.84·X This system has an infinite number of solutions. (2) ... and satisfies the condition that the sum of its elements is equal to 1 (100%)
Teaching sequence: 4. Mathematical treatment of the observations The system LX=0.84X has an infinite number of solutions. This characterizes the number 0.84! The long term growth factor is the (strictly positive) number for which the system LX= X has an infinite number of solutions, i.e. for which det(L-En)=0.
Teaching sequence: 5. Eigenvalues and eigenvectors unlike the example: eigenvalues may be negative! this means that the system AX = X has an infinite number of solutions A a square matrix (n n) A number is an eigenvalue of A iff det (A-En)=0. A column matrix X (≠ 0) is an eigenvector of A corresponding to the eigenvalue iff AX = X.
Teaching sequence: 5. Eigenvalues and eigenvectors Theorem (for Leslie matrices having two consecutive non-zero fertility rates) the long term growth rate (1) L has exactly one strictly positive, real eigenvalue 1. • One of the eigenvectors of L corresponding to the eigenvalue 1 is a column matrix X consisting of strictly positive numbers adding up to 1. • For every (realistic) initial age distribution, X(n)/t(n) (where t(n) is the total population after n steps) converges to X. the long term age distribution
Experiences with the teaching sequence:1. During the ‘Science Week’ • secondary school students visit universities and attend workshops concerning a scientific subject • my workshop: • part 1, 2 and 3 of the teaching sequence. incl. dependency ratio (approximated by #(I+IV+V)/#(II+III)) • spreadsheet: how to reach a stable population or a socially acceptable dependency ratio (by manipulating birth rates and survival rates, changing age of retirement, taking migration into account, ...)?
Experiences with the teaching sequence: 2. In mathematics teacher education • most students have Master degree in mathematics, some (more and more) have Master degree in a ‘related’ subject • students work through the whole teaching sequence: • workshop (part 1, 2 and 3) • homework (part 4, text with explanation and exercises) • positive reactions of students: • “Now I see why eigenvalues and eigenvectors are useful.” • students report that the teaching sequence stimulates critical thinking: subtle relation between mathematics and reality • Remarks of students show that the teaching sequence makes them think about the evolution of our population, i.e. “Are right-wing parties (who promote having more children) right?”
Experiences with the teaching sequence: 3. In my own mathematics teaching • end of introductory mathematics course for Bachelor students in applied economics • context is not ideal • students are not so good in mathematics • groups of 40-60 students • last topic of the year: no possibility to give students a home work, lack of time, ... • after theory about matrices, linear systems and determinants, but before the theory of eigenvalues and eigenvectors • part 2-5 of the teaching sequence • in combination with a simpler application (consumers switching between different brands of a product, simpler LT behaviour) • examination is not about modelling, but about (applications of) mathematics (slightly new contexts)
Experiences with the teaching sequence: 3. In my own mathematics teaching • questionnaire filled in by 20 randomly chosen students • Do the students find the teaching sequence • instructive? • interesting? • difficult? • General appreciation of the teaching sequence by the students?
Experiences with the teaching sequence:3. In my own mathematics teaching • Do the students find the teaching sequence instructive? • yes! • i.e. The students find that the teaching sequence shows • ... that mathematics can be used to describe reality. • ... that mathematical models are always a simplification of reality. • ... that matrices are useful. • less convincing: • The teaching sequence shows that eigenvalues and eigenvectors are useful. (two questions with different answers) • I learnt more about the evolution of the Belgian population.
Experiences with the teaching sequence: 3. In my own mathematics teaching • Do students find the teaching sequence interesting? • mixed opinions! • Do students find the teaching sequence (too) difficult? • no! • more difficult than the other examples in the course • mixed opinions concerning whether the presentation of the example could be understood during class • the example can certainly be understood after personal study at home • General appreciation • students find that more examples of this type should be treated in the course • appreciation correlates negatively to experienced rate of difficulty
Experiences with the teaching sequence: 3. In my own mathematics teaching • exam • students master the mathematical concepts (and applications) as good (or bad) as with traditional teaching • some typical errors are related to the use of the example • only positive eigenvalues? • one eigenvector versus all eigenvectors
The model of the Belgian statistical institute • ... is much more refined • age groups of 1 year and distinction between male and female • projections for smaller geographic entities (“arrondissement”, about 50 for the whole country) • birth and fertility rates are not constant • migration is taken into account • relatively short term: projections up to year 2050