Event-by-event flow and initial geometry from LHC
250 likes | 413 Vues
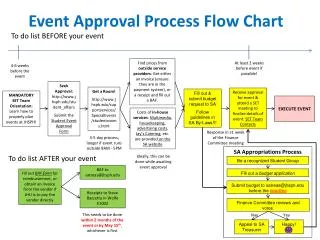
Event-by-event flow and initial geometry from LHC. Soumya Mohapatra. Jet Quenching Workshop, BNL 16 th April 2013. Importance of fluctuations. Initial spatial fluctuations of nucleons lead to higher moments of deformations in the fireball, each with its own orientation.

Event-by-event flow and initial geometry from LHC
E N D
Presentation Transcript
Event-by-event flow and initial geometry from LHC Soumya Mohapatra Jet Quenching Workshop, BNL 16th April 2013
Importance of fluctuations • Initial spatial fluctuations of nucleons lead to higher moments of deformations in the fireball, each with its own orientation. Alver, Roland (arXiv:1003.0194) Odd harmonics present vn is a distribution, can be characterized by mean and width Each harmonic has a separate phase (phases may be correlated) Large acceptance of the LHC experiments coupled with the increased multiplicity has allowed for great precision is studying the nature of these fluctuations Understanding the initial geometry is critical for understanding jet-suppression
OUTLINE • Multi-particle correlation measurements • Cumulants, 2PC, LYZ • Event by Event vn measurements • Event-plane correlations Emphasis on • Removing non-flow • Comparison between experiments and methods • Theory interpretation
Gaussian model of flow fluctuations For pure fluctuations vnRP=0 arXiv: 0708.0800 arXiv:0809.2949
Multi-particle correlations Sensitive to mean geometry and fluctuations Mean geometry only arXiv: 0708.0800 0809.2949 Limit when vnRP>>δn (i.e. Average geometry dominates over fluctuations) Expected for v2 in mid-central events Limit when vnRP->0 (Pure fluctuations) Expected to hold for v2 in central events and for higher order harmonics in all centralities Lee-Yang Zeros : Multi-particle correlations involving all particles in the event. suppresses non-flow Two particle correlations: similar to vn{2}, but often done with dh gap to suppress non-flow. Measures <vn2> Event Plane (EP) Method : Returns a value in between <vn> and <vn2>
v2 from multi-particle correlations v2{2} probably over-estimates <v22> Due to non-flow v2{EP} probably under-estimates <v22> Good consistency between LYZ and 4-particle cumulants : Reliable handle on average geometry! arXiv:1204.1409
Comparison across experiments ATLAS-CONF-2012-118 Good agreement among experiments for cumulants and even v2{EP}
pT dependence of EbE fluctuations arXiv:1205.5761 Ratio of fluctuations in v2 to mean v2 is relatively independent of pT Note that v2{EP} changes by an order of magnitude over this pT range but ratio is remarkably stable Hydro response factorizes of function of pT and initial geometry!
Higher order cumulants for v2 • Higher order cumulants such as vn{6},vn{8} all measure vnRP • vnRP is less susceptible to non-flow and so are vn{4}, vn{6},vn{8}. • ALICE results show consistency among them • Note these measurements are done in 1% bins (Good!)
Cumulant results v3 arXiv:1105.3865 • Relatively weak centrality dependence as compared to v2 • Sizable v3{4} is seen ~50% of v3{2} • Implies mean geometry effects for v3 ! • v3{4} /v3{2}=0.5 => v3RP/δ3 =0.8
Event by Event flow measurements Track distribution in three central events Corresponding two-particle correlations The large acceptance of the ATLAS/ALICE detectors and large multiplicity at LHC makes EbE vn measurements possible for the first time.
v2-v3 probability distributions v3 v2 v3 distributions are consistent with pure Gaussian fluctuations deviations in the tail (increases central->midcentral), Also see caveat in slide 11 For v2 pure Gaussian fits only work for most central (2%) events
v2 probability distributions via 2PC A. Timmins, Hot Quarks 2012 ALICE EbE v2 measurements obtained via 2PC followed by unfolding. v2 described by Bessel-Gaussian distribution: Contribution from mean geometry+fluctuations.
Relative fluctuations of v2 Can obtain mean, σ from EbE distributions And calculate σ/mean Black points are fluctuations estimated from cumulant method :
Comparison to cumulant results A. Timmins Hot Quarks 2012 Extracted v2{2}, v2{4} and sigma from EbE distributions are consistent with cumulant measurements
Non-flow bias on fluctuation measurements • Non-flow effects can bias the cumulant and EbE results • For cumulant the main effect is to enhance vn{2} • Can use vn{2} with Δη gap as substitute • vn{4} and higher cumulants relatively unaffected by non-flow • Can estimate non-flow from MC (ALICE EbE Measurements) • Not data driven • For EbE vn measurement the unfolding procedure can be used to remove non-flow (ATLAS Measurements) • Data driven procedure
Non-flow effects are mostly uncorrelated between sub-events • They are removed during unfolding • HIJING+Flow afterburner test demonstrates this • Get response function by dividing tracks with η>0 and η<0 into sub-events • Get response function by randomly dividing tracks into sub-events • Do unfolding with both response functions and compare to input vn distribution Non-flow effects : ATLAS EbE arXiv:1304.1471 Events Unfolded/True
Comparison to initial geometry: v2 For Glauber and CGC mckln • Rescale εn distribution to the mean of data 0-1% 5-10% 20-25% 55-60% 30-35% 40-45% Both models fail describing p(v2) across the full centrality range
Comparison to IP-Glasma model arXiv:1301.5893 1209.6330 (Gale, Jeon, Schenke, Tribedi, Venugopalan) Talk tomorrow by Bjorn Schenke
Complementary observables to vn • Correlation can exist in the initial geometry and also generated during hydro evolution • The correlation can be quantified via a set of correlators • This can be generalized into multi-plane correlations Correlation between phases of harmonic flow Glauber arXiv:1205.3585 arXiv:1203.5095 arXiv:1208.1200
Event plane correlations Initial geometry + hydrodynamic ATLAS-CONF-2012-049 arXiv:1208.1200 Heinz & Qui geometry only EbE hydro qualitatively reproduces features in the data
Compare with EbE hydro calculation: 3-plane Initial geometry + hydrodynamic ATLAS-CONF-2012-049 arXiv:1208.1200 Heinz & Qui geometry only Npart EbE hydro qualitatively reproduces features in the data
Cumulants provide overview into nature of fluctuations • v2{2} used to probe average geometry+fluctuations. • v2 {4}=v2 {6}=v2 {8}=v2RP and LYZ probe average geometry. • Dependence of vn on pT and initial geometry factorizes. • EBE measurements of v2, v3 and v4 distributions done by ATLAS and ALICE(v2). • EbE measurement handles non-flow. • Does not assume a particular form of the EbE distributions. • Distributions look Bessel-Gaussian like (deviations in the tail). • Distributions for v2, v3 and v4 well reproduced by IP-Glasma+MUSIC, but not by Glauber. • EP Corrs give further insight into initial geometry as well as hydro-evolution • Can differentiate hydro-effects from initial geometry effects. • Also gives information on initial geometry. Summary