Operational Risk Measurement
Operational Risk Measurement. Linda Allen Professor of Finance Understanding Market, Credit and Operational Risk: The Value at Risk Approach Allen, Boudoukh and Saunders Blackwell Publ., 2004. Definition.

Operational Risk Measurement
E N D
Presentation Transcript
Operational Risk Measurement Linda Allen Professor of Finance Understanding Market, Credit and Operational Risk: The Value at Risk Approach Allen, Boudoukh and Saunders Blackwell Publ., 2004.
Definition • Kingsley, et al. (1998) define operational risk to be the “risk of loss caused by failures in operational processes or the systems that support them, including those adversely affecting reputation, legal enforcement of contracts and claims.” • Can include strategic and business risk. • Breakdowns of people, processes and systems (usually, but not limited to technology) within the organization.
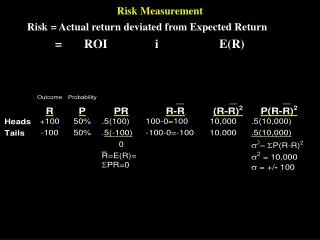
Distribution of Operational Risk Events • High Frequency, Low Severity events – may be insurable or can be priced • Low Frequency, High Severity events – catastrophic risk. • Expected Losses = EL = PE x LGE • PE=probability of operational risk event • LGE=loss given event • Figure 5.1
Top Down Models • Measure overall cost of operational risk events across firm using broad metrics. • Multifactor Models • Data: equity returns and operational risk indices • Income Based Models • Examines income volatility = Earnings at Risk • Expense Based Models • Volatility of adjusted expenses • Operating Leverage Models • Fixed relationship of operating expenses to assets. • Scenario Analysis • Risk Profiling Models • Key Risk Indicators such as trading volume, staff turnover, overtime, no. of incident reports, backlogs,..
Pros and Cons of Top Down Models • Pros: • Data availability • Ease of estimation • Can use industry-wide metrics to proxy for LFHS events • Can be used to estimate capital requirements • Cons: • Cannot diagnose risk problems (weak points) • Back-ward looking • Cannot incorporate risk mitigation techniques • Over-aggregated
Bottom Up Models • Process Approaches • Causal Networks or Scorecards • Connectivity Models • Reliability Models • Actuarial Approaches • Empirical Loss Distributions • Parametric Loss Distributions • Extreme Value Theory
Causal Networks • Break down complex processes into steps to analyze possible operational risk events. • Data on risk factors are related to process map to score impact of risk at each step. • Event trees: another form of risk scorecard. • Choose correct level of aggregation (don’t ignore interdependencies) or disaggregation (not overly complex). • Subjective. Must assign probabilities to each event.
Connectivity Models • Focus on cause rather than effect. • Fishbone analysis to determine impact of a failure in the procedure on the entire process. • Fault tree assesses weak points in process, but must assign (subjective) probabilities.
Reliability Models • Estimates hazard rate of arrival of failure (operational risk event). • Can estimate separate intensity functions for HFLS and LFHS events. • Data requirements are very high.
Loss Distributions • Empirical (see Figure 5.1) • Parametric • Exs: exponential, Weibull or beta distributions. • Separate distributions for HFLS and LFHS events. • Onerous data requirements. • Figures 5.7 a, b, c
Extreme Value Theory • The tails may have different distributions than the area around the mean. • Can define the Expected Shortfall = mean of the tail of the distribution. • Use Generalized Pareto Distribution.
Proprietary Database: OpVar • Contains >7,000 publicly revealed operational risk events. • Total of US$272 billion in operational risk losses across different firms and industries. • 10 years with semiannual updates. • Strategic alliance between NetRisk and PwC.
Operational Risk Measurement is becoming more important as: • Move to T+1 settlement in June 2005 • Adopt BIS New Capital Accord in 2006 • As market risk is transformed into credit risk which is transformed into operational risk. • But: Use of similar models and pooled databases may encourage mediocrity as “best practices.” • Possible procyclical or counter cyclical effects.