Understanding General Linear Models for fMRI Data Analysis
This lecture by Dr. Emily Falk from the University of Pennsylvania provides a comprehensive overview of the General Linear Model (GLM) approach in functional Magnetic Resonance Imaging (fMRI) data analysis. It covers key preprocessing steps, including de-noising, realignment, slice timing correction, and normalization of structural images. Emphasis is placed on hypothesis testing, model fitting, and statistical inference—crucial for interpreting brain activity concerning experimental variables. The lecture also outlines second-level group GLMs and discusses challenges like signal-noise ratio and multiple comparison corrections.

Understanding General Linear Models for fMRI Data Analysis
E N D
Presentation Transcript
GLM for fMRI Emily Falk, Ph.D. University of Pennsylvania Thanks to Thad Polk and Elliot Berkman
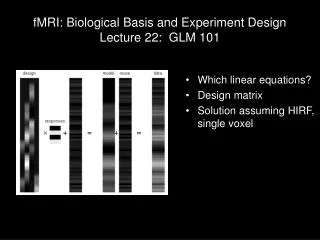
(De-noise) Realign Slice Timing Correct Smooth Predictors AcquireFunctionals Y X y = Xβ + ε Template 1st level (Subject) GLM Determine Scanning Parameters β Co-Register βhow - βwhy Normalize Acquire Structurals (T1) Contrast All subjects 2nd level (Group) GLM Threshold
Determine Scanning parameters Temporal Resolution Signal-Noise Ratio (SNR) - - - - Coverage/ Field of View Spatial Resolution -
(De-noise) Slice Timing Correct Acquire Functionals Determine Scanning Parameters Acquire Structurals (T1)
Slice 4 Slice Slice 3 Slice 2 Slice 1 TR #1 TR #2 TR #3 TR #4 Time
(De-noise) Realign Slice Timing Correct Acquire Functionals Determine Scanning Parameters Acquire Structurals (T1)
Realignment Minimize sum of squared diff reslice
(De-noise) Realign Slice Timing Correct AcquireFunctionals Template Determine Scanning Parameters Co-Register Normalize Acquire Structurals (T1)
Co-registration Can’t use minimized squared difference on different image types (different tissue -> signal intensity mapping) Instead use mutual information (maximize) reference moved image
normalization 12 parameter affine transformation Trans x Pitch x Roll x Yawx Zoom x Sheer Sheer Zoom Even better with segmentation!
(De-noise) Realign Slice Timing Correct Smooth Predictors AcquireFunctionals Y X Template Determine Scanning Parameters Co-Register Normalize Acquire Structurals (T1)
Forming predictors How Why X = Events Basis Function Predictors (X)
(De-noise) Realign Slice Timing Correct Smooth Predictors AcquireFunctionals Y X y = Xβ + ε Template 1st level (Subject) GLM Determine Scanning Parameters β Co-Register βhow - βwhy Normalize Acquire Structurals (T1) Contrast All subjects 2nd level (Group) GLM Threshold
(De-noise) Realign Slice Timing Correct Smooth Predictors AcquireFunctionals Y X y = Xβ + ε Template 1st level (Subject) GLM Determine Scanning Parameters β Co-Register βhow - βwhy Normalize Acquire Structurals (T1) Contrast All subjects 2nd level (Group) GLM Threshold
Lecture Outline • Hypothesis Testing (covered Sunday) Null hypothesis vs. alternative hypothesis; Testing hypotheses about population based on a sample; Sampling distributions & Central Limit Theorem; t-statistic, t-distribution, t-tests, p-values; Interpreting results, Type I error, Type II error; One-tailed vs. two-tailed tests; Multiple comparisons • General Linear Model Regression, multiple regression, model fitting, matrix notation, design matrix, example, issues • Overview of fMRI data analysis Build design matrix, fit model to get betas, contrasts, statistical parametric maps, threshold for significance (correcting for multiple comparisons)
Statistical Model In fMRI, we experimentally manipulate various independent variables (e.g., task, stimulus) while scanning We are interested in constructing a model of the predicted brain activity that can be used to explain the observed fMRI data in terms of the independent variables. In fitting the model to the data, we obtain parameter estimates and make inferences about their consistency with the null hypothesis.
General Linear Model The General linear model (GLM) approach treats the data as a linear combination of predictor variables plus noise (error). The predictors are assumed to have known shapes, but their amplitudes are unknown and need to be estimated. The GLM framework encompasses many of the commonly used techniques in fMRI data analysis (and data analysis more generally).
The GLM Family DV Predictors Analysis Regression Continuous One predictor Multiple Regression Continuous Two+ preds One continuous 2-sample t-test Categorical 1 pred., 2 levels General Linear Model One-way ANOVA Categorical 1 p., 3+ levels Factorial ANOVA Categorical 2+ predictors Two measures, one factor Paired t-test Repeated measures More than two measures Repeated measures ANOVA
A simple linear model with one predictor (a made up, non-fMRI example) • Fit a straight line to the data, the “best fit” • This line is a simplification, a model with two parameters: intercept and slope • Can use the model to make predictions • Can test the slope parameter against a null hypothesis of zero, and make inferences about whether there is a statistically significant relationship Blushing (blood flow to cheeks) Attractiveness
The Regression Model • Vector notation: y, x, and e are vectors of N values corresponding to N observations Outcome (DV) Intercept (constant) Error (residual) Predictor value slope For point i:
Fitting and Residual Variance • The line is being pulled by vertical rubber bands attached to each point. Vector of red lines is e • Minimize squares of vertical distance to lines. Minimize: Blushing (blood flow to cheeks) Attractiveness
The Multiple Regression ModelBasic Model for the GLM • Structural Model for Regression DV Pred1 Pred2 Predk Variables Parameters Slope 1 Slope k intercept Slope 2 Error Matrix notation • solve for beta vector • minimize sum of squared residuals
Matrix Notation • Alternatively, we can write as Design matrix Residuals Observed Data Model parameters
Matrix Notation Design matrix Residuals Observed Data Model parameters Is this same as
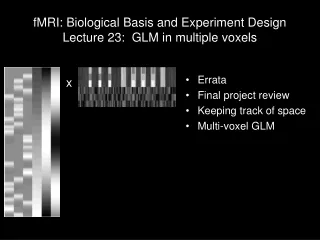
Design Matrix In fMRI the design matrix specifies how the factors of the model change over time. The design matrix is an np matrix where n is the number of observations over time and p is the number of model parameters
Another Made-up, Non-fMRI Example • Does exercise predict life-span? • Control for other variables that might be important. i.e., gender (M/F) Females Males
A Non-fMRI Example Outcome Data Design matrix Model parameters Residuals = + X
Multicollinearity • Coefficients (betas) for individual predictors test for variance uniquely explained by that predictor • When predictors are intercorrelated, interpreting the betas can become very tricky! • Changes in sign of one beta when you add others • Changes in significance of one beta when you add others • This is because the predictors are attempting to explain the SAME variance • This is called multicollinearity.
Implications for fMRI • You have at least some control over the design matrix, X, because you manipulate the stimulation. • Avoid multicollinearity and complex issues with good experimental design! • Do not use a design with many or highly correlated predictors and expect the modeling to sort everything out
Lecture Outline • Hypothesis Testing (covered last night) Null hypothesis vs. alternative hypothesis; Testing hypotheses about population based on a sample; Sampling distributions & Central Limit Theorem; t-statistic, t-distribution, t-tests, p-values; Interpreting results, Type I error, Type II error; One-tailed vs. two-tailed tests; Multiple comparisons • General Linear Model Regression, multiple regression, model fitting, matrix notation, design matrix, example, issues QUESTIONS?
Lecture Outline • Hypothesis Testing (covered last night) Null hypothesis vs. alternative hypothesis; Testing hypotheses about population based on a sample; Sampling distributions & Central Limit Theorem; t-statistic, t-distribution, t-tests, p-values; Interpreting results, Type I error, Type II error; One-tailed vs. two-tailed tests; Multiple comparisons • General Linear Model Regression, multiple regression, model fitting, matrix notation, design matrix, example, issues • Overview of fMRI data analysis Model specification, parameter estimation, contrasts, statistical parametric maps, threshold for significance (correcting for multiple comparisons)
A simple research question? • What are the neural correlates of positive valuation (see recent meta analysis by Bartra et al.)
On X1 Off On X2 Off Time
β2 β2 β1 β1 β2 β2 β1 β1 β2 β2 β1 β2 β1 β1 β2 β1 β2 β2 β1 β2 β2 β1 β1 β1 β2 β1 β2 β2 β1 β2 β2 β1 β1 β1 β2 β2 β1 β1 β2 β1 β1 β2 β1 β2 β2 β1
The SPM way of Plotting the Variables X y e + =
contrast ofestimatedparameters T = varianceestimate T-test – contrasts – SPM{t} Question: Difference between seeing loved one and random face > 0 ? = b1 – b2 = cTb> 0 ? cT = 1 -1 0 0 0 0 0 0 b1b2b3b4b5 ... H0: cTb=0 Null hypothesis: Test statistic:
1 10 20 30 40 50 60 70 80 0.5 1 1.5 2 2.5 Design matrix T-test: Another Simple Example Whyversus rest Q: activationduringattribution? cT = [ 1 0 ] Null hypothesis: 1=0
Isolating Mental Processes • Tasks are typically designed to isolate mental processes of interest by comparing parameter estimates (betas) • Viewing hot vs. neutral faces • Why vs. how • The comparison involves a linear combination of the parameter estimates • Note: investigating a single parameter estimate is also a contrast and sometimes termed a contrast against the implicit baseline
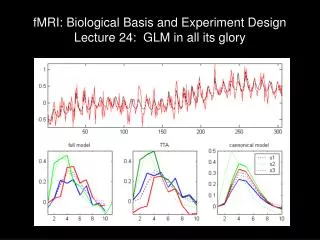
Model specification Parameter estimation Hypothesis Statistic Voxel-wise Time Series Analysis Time Time BOLD signal single voxel time series SPM
fMRI Example: One Voxel amplitude time Source: J-B. Poline Temporal series fMRI voxel time course
Model Specification:Building The Design Matrix fMRI Data Design matrix Residuals Model parameters = + X Predicted task response intercept
Parameter Estimation/Model Fitting Find values that produce best fit to observed data y = 0 + 1 + ERROR
The SPM Way of Plotting the Variables y X e + =
What SPM Computes • F-contrast • spm_ess_####.img • Extra sum-of-squares image • spm_F_####.img • F-statistic image • ResMS.img • Residual sum-of-squares (σ2) • beta_####.img • Parameter estimates (β) • T-contrast • spm_con_####.img • Contrast image • If you take the appropriate beta_####.img’s and linearly combine them, it will be identical to the spm_con_####.img • spm_T_####.img • T-statistic image