Download
1 / 14
140 likes | 214 Vues
Analyzing ticket sales to determine profitable combinations, graphical representation using linear inequalities, maximizing profit.

E N D
A-REI Represent and solve equations and inequalities graphically 12. Graph the solutions to a linear inequality in two variables as a half-plane (excluding the boundary in the case of a strict inequality), and graph the solution set to a system of linear inequalities in two variables as the intersection of the corresponding half-planes.
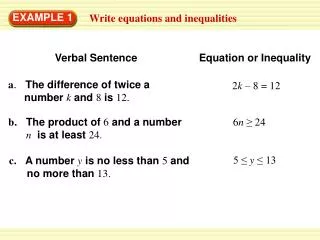
Write and graph a system of linear inequalities to describe the problem. An arena contains 1200 seats. For an upcoming concert, some seats will be priced $12.00 while other seats are $10.00. 500 $10 tickets have already been sold, and the total sales must be at least $7200 to make a profit. What are some possible combinations of tickets that can be sold to make a profit?
7. An arena contains 1200 seats. For an upcoming concert, some seats will be priced $12.00 while other seats are $10.00. 500 $10 tickets have already been sold, and the total sales must be at least $7200 to make a profit. What are some possible combinations of tickets that can be sold to make a profit?
Since it is not possible to Sell negative amount of Tickets, what two other Inequalities should be Considered? What do these additional inequalities Tell you about the graph of this system? Only the quadrant I Will be used. http://my.hrw.com/math06_07/nsmedia/tools/Graph_Calculator/graphCalc.html
If 400 $12 tickets where sold, how many • $10 tickets can be sold? At most 800 $10 tickets.
Would (700.5, 400) be a solution to this equation? Not for the problem stated, because You cannot purchase half a ticket.
No, because at least 500 tickets must be sold at $10, and that would make the total number of tickets greater than 1200. Can 900 $12 tickets be sold?
What is the intersection Of the two lines, and what Does it represent in this Situation? (700, 500) It represents The maximum number Of $12 tickets that can be sold.
What is the maximum number Of $10 tickets that can be sold? What would be the total sales? The Max number of $10 tickets is 1200 (meaning zero $12 tickets were sold). The total sales would be $12,000
What is the y-intercept of the red line? What does it represent in this situation? The y-intercept is 720. If you sold zero $12 tickets then you must sell 720 $10 tickets to make a profit.
What is the intersection of the Red and Blue lines? What does It represent in this situation? (183⅓, 500) This ordered Pair is represents the minimum amount of tickets that must be sold in order to make a profit. However because you cannot sell ⅓ of a ticket an adjustment must be made.
What is the minimum amount of each ticket that must be sold in order to make a profit? What Is the amount of total sales? 184 $12 tickets and 500 $10 tickets. Total Sales: $7208.
What combination of ticket sales Would maximize the profit? What would be the total sales? 700 $12 tickets and 500 $10 tickets. Total Sales: $13,400
Does this situation have infinitely Many ticket combinations? No, the solutions are Within a finite area, and all combinations must be whole numbers.