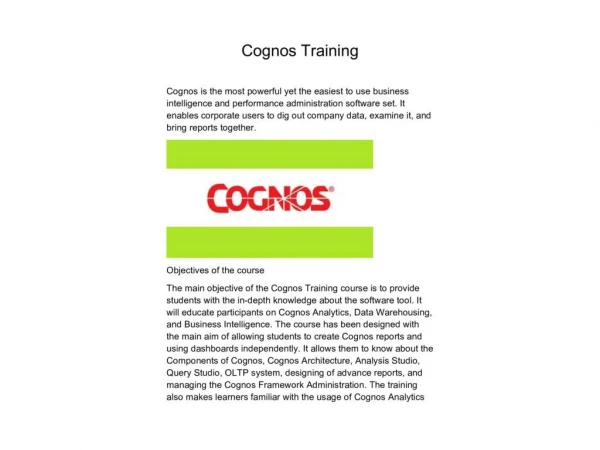
Tivoli Common Reporting through Cognos
570 likes | 1.28k Vues
Antonio Sgro, SAPM Best Practices Senior IT Architect antonio.sgro@it.ibm.com. Tivoli Common Reporting through Cognos. Disclaimer.

Tivoli Common Reporting through Cognos
E N D
Presentation Transcript
Antonio Sgro, SAPM Best Practices Senior IT Architect antonio.sgro@it.ibm.com Tivoli Common Reporting through Cognos
Disclaimer The information on the new product or component is intended to outline our general product direction and it should not be relied on in making a purchasing or sales decision. The information on the new product or component is for informational purposes only and may not be incorporated into any contract. The information on the new product or component is not a commitment, promise, or legal obligation to deliver any material, code or functionality. The development, release, and timing of any features or functionality described for our products remains at our sole discretion.
Tivoli Common Reporting - Mission Statement • Provide a solution which converges around an incredibly simple launch point for reports, where users can see what is available and use it with no training • Provide an effective way to deliver and share reports and reporting ideas, and find the set of content that gives the greatest value • Focus the individual reports on quality of information and value, not on the quantity of reports available • Provide consistency of the content and enable linkage between reports for best analysis flow, even if they cross individual product boundaries
Tivoli Common Reporting moving forward • IBM Cognos 8.4 BI Reporting added to TCR • Includes UI to administer reports and edit reports • Enables cross-domain analytics and reporting • Brings industry leading reporting suite to Tivoli customers at no additional charge • License restricts usage to reporting on “Tivoli data” or Other data joined with Tivoli data
Terms applicable to Supporting Programs: TCR .next • The Program includes IBM Tivoli Common Reporting (“TCR”) which includes the reporting and modeling components of IBM Cognos Business Intelligence (the "IBM Cognos BI Components") which are subject to the following limited use license. • Licensee is authorized to use the IBM Cognos BI Components only to support Licensee's use of the Program under this Agreement and within the limits of the Proofs of Entitlement for the Program (unless broader rights are provided elsewhere in this License Information document). The phrase "to support Licensee's use" includes only those uses that are necessary or otherwise directly related to a licensed use of the Program. The IBM Cognos BI Components are to be used only by the internal components of TCR for performing reporting and analytics on data that is (i) generated directly by a Tivoli-branded IBM software product; (ii) user-generated and managed by a Tivoli-branded IBM software product; or (iii) used in conjunction with data in (i) or (ii). By way of example of data described in (iii), Licensee may use the IBM Cognos BI Components to report on non-Tivoli-branded IBM software product data which has been joined to another Tivoli-branded IBM software product. The IBM Cognos BI Components may not be used in a stand alone fashion or, except as otherwise specifically provided, with data which is not related to a Tivoli-branded IBM software product.
Tivoli Common Reporting Focus • Extend the Usability and Consumability of current TCR reports and reporting tools • Simplified interfaces and interactions for report writers to create, customize, and publish reports – let’s you build reports faster and easier • Extend the level of cross-product report linkage for seamless flow between related reports, blurring the boundaries among Tivoli products • Enable report end-users to create and save ad-hoc reports, without the need for a report writer’s involvement • Integration of BIRT-based and Cognos-based reporting within TCR • The continued adoption of TCR across the Tivoli portfolio • Drive for new out-of-the-box reports for products in all areas – Maximo, Storage, Security, Service Availability and Performance Management, Service Delivery and Process Automation
Value that Cognos will bring to Tivoli customers • Simplified report editing • Launch web-based Report Studio in context from a report • You can run an out-of-the-box report, like an ITM report, and launch the editor in context to change something • Ad-Hoc Reporting • Create ad-hoc, on the fly reports • Even novice users will be able to rapidly create reports with intuitive drag & drop function via the Query Studio, allowing for greater report usage with little training • Other capabilities • Automatic emailing of reports • Additional report formats • XML • Excel 2000 & 2000 Single Sheet, 2002, and 2007 • CSV • Granular data security (row-level authorization)
Value Proposition • Consistency in reporting with other Tivoli products will be achieved • Will be basis of end-to-end reporting for Tivoli • Allowing report data correlation with other Tivoli product data and business data (e.g. asset management, financial planning etc) • Including longer term goal of single reports using data from multiple Tivoli Products • Will provide ad-hoc reporting capabilities • Standard architecture (TIP/eWAS) will be supported • Allowing customers access (via upgrade) to IBM Cognos advanced analytics modules for advanced reporting capabilities never possible before • Will be able to drill down, slice and dice to see what is driving client’s business • What if Analysis • Trend Analysis and Forecasting Note: Will supplement other Tivoli product UI efforts (Operational console for monitoring/troubleshooting)
TCR 1.1/1.2 to TCR .next Upgrade Key Points • Existing TCR customer will have a smooth upgrade to the new Cognos Based TCR in the second half of 2010 as part of the TCR .next release • The current time and effort you have invested in TCR 1.1 or 1.2 based reports will not be wasted with the new TCR solution • BIRT based reports will continue to be usable in the new system • If you want to keep using your old reports, or edit them, etc., you can
Tivoli Common Reporting 1.3 and .next Components Query Studio (web-based) • Intuitive, self-service “ad hoc” reporting • Drag and drop • Easy sorting and filtering • Save, edit, and share Report Studio (web-based) • Create and edit more advanced reports • Query Studio functions plus • Parameterization • Globalization • Advanced query manipulation • Additional chart types (e.g., maps, gauges) Framework Manager • Common infrastructure • Plug-and-play • Common security, metadata, administration, and portal • Ability to adapt deployment as infrastructure changes
TCR for A&PM & .next Report Designers Query Studio Available through the TIP interface Report Studio Launched via a drop down tool from the TIP interface
TCR for A&PM & .next Framework Manager Launched as a OS native Java application
Framework Manager • Provides a common infrastructure across all adopting Tivoli products • Framework services make the TCR solution plug-and-play, saving IT both time and resources • Applications share a common security, metadata, administration, and portal • Ability to adapt your current deployment as your own infrastructure changes • Can extend capabilities to other areas of your organization through up-sell options to Cognos BI modules • Enables: • Lowest cost of ownership • Fastest time to results • Consistent data across the enterprise • Performance software that works the way people think
Which Version of TCR? • Important Notes • Reports and models created in 8.4.0 will run and are supported on 8.4.1 • Reports and models created on 8.4.1 officially are not supported to run on older versions of the Cognos report engine
One Minute Reporting • Uses TCR-Cognos to create a new ITM report in under 60 seconds • Drag and drop of key metrics such as memory, disk and CPU utilization • Organized by user defined business groups and operating system
TIP Server TCR Architectural Overview TCR 1.2 ISC/JSR168 Web UI Report Store Rendering Engine with Plug-ins Report Store Import report definitions BIRT Reports Report Data Sources Report Output
TCR 1.2 Report Designer BIRT report designer via Eclipse Launched as a stand alone Java application
TIP Server TCR Architectural Overview TCR for Asset & Performance Management Cognos UI in TIP for Cognos report administration View Cognos based Report BIRT ISC/JSR168 Web UI Report Store CLI –BIRT only BIRT Reports Report Data Sources View BIRT based Report iFrame Cognos Reports Existing TCR UI for legacy reports Cognos Server Report Data Sources UI Cognos report processing Report Store
TIP Server TCR BIRT (optional) Tivoli Common Reporting .next - Architecture View any Report ISC/JSR168 Web UI CLI – All reports BIRT Reports (optional) Cognos Reports iFrame Cognos Server UI Report Data Sources Cognos report processing Report Store
TCR .next Conversion Assistant* 1. Extract key report info Conversion Assistant annotates the TCR BIRT report (below) with SQL queries and other info 3. Complete final Cognos based TCR report User completes report using TCR Report Studio (below) to fill in details 2. Generate draft Cognos based TCR report Conversion Assistant creates draft new TCR report, preserving layout and annotating actions user should take *Available from TCR .next
Tivoli Common Reporting Reports for IBM Tivoli Monitoring 6.2.2
COGNOS reports for OS Agents • Background: • IBM Tivoli Monitoring reports were based on BIRT technology • Reports were posted on OPAL web site (not a product out of the box solution) • Current Status • ITM 6.2.2 FP02 delivered TCR 1.3 • ITM 6.2.2 FP02 delivered the first 5 OS Agents reports with forecasting and the Cognos Data model for on the fly and report studio reports • Other ITM Agents delivered Cognos Reports (VMWare) and System P Agents are on the field
OS Agents Cognos Reports Roadmap • Roadmap • TCR 2.1 by 1H 2011 • 27 new OS Agents Cognos reports by 1H 2011 • An improved data model (raw data support for better capacity plan)
VMWare TCR Reports • Top N VMs by Host: This report shows the most utilized or top N virtual machines by CPU and Memory Utilization on one or more host servers on a cluster. The user can select a cluster and host (one, many or all), a time range and the number of VMs to display. The virtual machine names on the list are hyperlinks that drill down to a daily trend or line chart over time for that virtual machine. From the daily trend chart it is possible to drill through to hourly trend chart by clicking on a particular date. • Bottom N VMs by Host: This report shows the least utilized or bottom N virtual machines by CPU and Memory Utilization on one or more host servers on a cluster. The user can select a cluster and host (one, many or all), a time range and the number of VMs to display. The virtual machine names on the list are hyperlinks that drill down to a daily trend or line chart over time for that virtual machine. From the daily trend chart it is possible to drill through to hourly trend chart by clicking on a particular date. • Top N VMs by Resource Pool: This report shows the most utilized or top N virtual machines by CPU and Memory Utilization on one or more resource pools on a cluster. The user can select a cluster and resource pool (one, many or all), a time range and the number of VMs to display. The virtual machine names on the list are hyperlinks that drill down to a daily trend or line chart over time for that virtual machine. From the daily trend chart it is possible to drill through to hourly trend chart by clicking on a particular date. • Bottom N VMs by Resource Pool: This report shows the least utilized or bottom N virtual machines by CPU and Memory Utilization on one or more resource pools on a cluster. The user can select a cluster and resource pool (one, many or all), a time range and the number of VMs to display. The virtual machine names on the list are hyperlinks that drill down to a daily trend or line chart over time for that virtual machine. From the daily trend chart it is possible to drill through to hourly trend chart by clicking on a particular date.
VMWare TCR Reports • VM Details Daily: This report shows the daily CPU and Memory utilization trend of one or more virtual machines (on one or more host servers) on a cluster over time. The user can select a cluster, host server (one, many or all) and VM (one , many or all) and a time range. . From the daily trend chart it is possible to drill through to hourly trend chart by clicking on a particular date. • VM Details Hourly: This report shows the hourly CPU and Memory utilization trend of one or more virtual machines (on one or more host servers) on a cluster over time. The user can select a cluster, host server (one, many or all) and VM (one , many or all) and a time range. • Server Heat Chart: This report shows patterns of CPU and/or memory utilization over a period of time for the selected server(s) on a cluster in an hourly heat map format. The user can select a cluster and host servers (one, many or all). • VM Heat Chart : This report shows patterns of CPU and/or memory utilization over a period of time for the selected virtual machine(s) in an hourly heat map format. The user can select a cluster , host servers (one, many or all) and VM (one, many or all)
Trend Comparison Charts Report Screenshots Top Virtual Machines by CPU Utilization Stacked LPAR CPU Utilization
Report Screenshots Memory Utilization Heat Chart Application Response Time Cell Tower Performance
Self Service Drag and Drop Ad-Hoc Reporting through Query Studio Drag and Drop Data Model
Objectives • Develop cross product reporting that shows analytical and product integration capabilities of new TCR based on Tivoli Reporting and Analytics Model (TRAM) strategy • Develop standards, tools and components for modeling and analytical reporting to enable Tivoli portfolio for scalable and manageable reporting solution for IT management • Create highly consumable TCR enablement process that allows Tivoli product to quickly move to new TCR solution • Facilitate development and delivery of cross product reports • END GOAL: Enable customers to rapidly ask questions and get the answers based on multiple data sources (Tivoli products)
Architecture overview Tivoli Common ReportingConsole Tivoli Common Reporting for Asset and Performance Management server (TIP) Cognos BI Modeling ISC/JSR168 Web UI Cognos BI Reporting TDW TivoliData Warehouse UI DB2 Client (native database client) Cognos report processing Report Store TRAM Tivoli Reportingand Analytics Model Common dimension population utility Tpae / Maximo ecosystem DB(TSRM / CCMDB) TADDM Tivoli Application Dependency Discovery Manager
ClientA Client B Client C Gathering customers questions • Product managers contacts • Sales and services contacts • Global Tivoli Users Group • Tivoli development • Plan • Intent is to trigger further questions from the field • Validate feasibility for selected scenarios (available data, resources, product plans) • Implement (some additional integration work will be required)
Selection of questions • What's the average usage level for servers which are components of a particular business service/business application? • Which servers can be consolidated due to the fact that they are not utilized much and they do not have many application servers running on them? • How does a fault impact my performance and what was the performance leading up to the fault? • How does a change on my system (upgrade/patch/etc) affect the system performance (memory/CPU/transaction response time)? • Who are the users that are involved in the infection of the IT infrastructure and who are the ones I need to focus on when raising awareness on security threats? • Which components and business services would be impacted and to what degree (offline/degraded) by failure of specific component?
Question analysis • Question • What's the average usage level for servers which are components of a particular business service/business application? • Interpretation • Customer mentioned about this capability in case of ITM and ITCAM reports. They would like to get the report about their business services components. They don't want to select each particular server and get the resources utilization or availability data for one server only. They would like to get the report which will combine information about the machines participating within business service. • Products involved • TBSM or TADDM • ITM (OS Agent)
TSAM & Cloudburst Virtual Infrastracture Consistency Reports • Problem Statement • Potential lack of consistency of information about virtualized environement in TSAM management infrastructures • Resolution through Reports • VM Existence Report • List all available VMs per DCM and hypervisors • Orphaned Object Report • List orphaned objects: VMs, IP, images, storage nodes
TSAM – cross product reporting – scenario 1 Problem statement: TPM Data Center Model holds information what is running on each host system (VMWare images running on ESX, etc). This configuration data can easily get out of sync in case of an infrastructure failure (for example one of the hosts with several virtual machines crashes). This is a weak point of current TSAM solution. The report can help administrator to find out if current DCM is up to date and take corrective actions if necessary. VM Existence Report • Value for the user (TSAM administrator): • Show what is on each host per Data Center • Model and per hypervisors • The sources for report: • TPM • Hypervisors (external products)
TSAM – cross product reporting - scenario 2 Problem statement: In current TSAM solution there is a possibility that some resources will exist without suitable reflection in component databases (VMs without reference to a service, IP addresses reserved but not used). The failure can produce inconsistency between information stored in component databases (TSAM, SRM, TPM) and real state on hypervisors. This set of reports can help identify those orphaned resources. Orphaned Object Reports • Value for the user (TSAM administrator): • Facilitate handling of TSAM server failures • Orphaned objects: • VMs, IPs, images, storage nodes • The sources for report: • TSAM (SRM) • TPM • Hypervisors (external products)
Model merging explanation Cross-products Cognos Package ITM OS Agent Cognos Model TDW TivoliData Warehouse uses TRAM Cross-products Cognos Model publish merge by development TRAM Tivoli Reportingand Analytics Model Report Studio develop reports which can be included into the package Query Studio create ad-hoc reports TADDM Tivoli Application Dependency Discovery Manager TRAM TADDM Cognos Model
Incidents over resources utilization (TSRM/ITM) Problem statement: What was my system performance before the problem was reported? What is my system performance after the change introduction? Incidents / Problems / Changes can be marked over utilization chart Different metrics from ITM can be visualized on this kind of chart (disk, memory, etc.) User can easily examine system performance (like CPU utilization) before issue was reported or after change implementation.
Incident facts aggregation (TSRM/TADDM/ITM) Incidents / problems / changes can be aggregated within additional dimensions (defined by data gathered in TADDM) Problem statement: Which hardware/operating system is causing the biggest number of issues? Show me CPU/memory/disk usage on the servers that have more than N incidents in the last week. Different incident / problem / change facts can be aggregated Different groupings are possible here: • by manufacturer or model of the server • by business service Facts from ITM can be added here as well
Customer Value • Current Customers will get the answers to well defined, common questions through the report outputs • Ability to answer more questions not covered by Tivoli deliverables (self-service reporting Cognos) • Customers will know how to get the answers by means of self-service reporting • General benefits of cross-product reporting • Bringing new facts to light • Easy integration of different products, different technologies • Single access point for multiple data sources • No database skills required for business users (self-service reporting Cognos)
Your Cross Product Report Questions • Please help to support this project by contributing your questions to: • The Global Tivoli User Community -> Community forums home ‹ Product Forums ‹ Reporting -> Cross Product Reporting • (http://discuss.tivoli-ug.org/forum/viewforum.php?f=27) • Or for IBM’ers in the room… • W3 -> IBM forums > software > tivoli > reporting -> Cross product reporting • (http://ibmforums.ibm.com/forums/thread.jspa?threadID=529116)
FAQ • Why are you changing the underlying architecture for TCR? • While TCR has been very successful in providing a lot of out of the box value for our customers, the addition of Cognos to the Tivoli portfolio provides greater capabilities because of the Cognos report engine and its superior reporting capabilities. We elicited feedback from many customers before deciding that this was the best approach to take to create greater value for integrated reporting • Will my BIRT reports still work in the new TCR offering? • Yes, your existing reports will still work. We are including a BIRT engine into the new release of TCR and any BIRT based reports will be identified and dispatched to the BIRT report runner • Will the new TCR offering include the full Cognos 8 release? • No, the release will only include the basic Cognos reporting capabilities, which include Query Studio, Report Studio, Framework Manager, and Report Viewer • Will I still be able to build reports in the standalone Eclipse/BIRT designer and add them to my solution? • Yes, you can still continue to build your reports via the Eclipse/BIRT report designer • Will I be able to build BIRT reports via the TIP UI? • No, any new reports built via the web-based TIP/TCR Report or Query Studio will be Cognos based definitions
FAQ (cont.) • What are the difference between TCR Report Studio and Query Studio? • Report Studio is used to create sophisticated reports and charts with complex prompts and filters. Query Studio is used to create ad hoc queries and simple reports and charts • What do I do if I want to change all of my reports over to the new TCR solution? • We are providing a move assistant which will assist with the conversion process, from BIRT based TCR reports to Cognos based TCR reports. This assistant does not provide a complete conversion and some user intervention is required for each report being converted • Will BIRT eventually be deprecated? • We have no plans to deprecate BIRT at this time • Why are there different releases of TCR coming out? • We are releasing a version of TCR for Asset and Performance Management this year as a directed effort to validate the solution and for products which have not previously included the current TCR solution, Tivoli process automation engine (Tpae) and Tivoli Netcool Performance Manager (TNPM). In 2010 the new TCR solution will be made available to other IBM Tivoli offerings for incorporation into their respective solutions
FAQ (cont.) • Will Tivoli products which deploy with the new TCR release come with BIRT or Cognos based reports • Tivoli Products which deploy with the new TCR release will bundle a set of Cognos based TCR reports and framework model which make use of the new capabilities and functionality. If the Tivoli product was previously released with TCR 1.2 then over time we anticipate the Tivoli products with BIRT based TCR reports to be replace by Cognos based TCR versions • Is the new TCR solution a complete replacement of all existing TCR function? • The new release of TCR will augment the existing capabilities provided with TCR 1.2. If you have a Tivoli product which incorporates the TCR 1.2 release, the upgrade to the release of that product which has TCR .next will be a clean process • Will the new TCR give me analysis type capabilities? • No, as this is a free offering, we are only able to provide basic reporting capabilities. If your business needs more advanced BI type functionality, then there is an option to buy an upgrade to the full Cognos 8 BI offering which includes Analysis Studio, Power Cubes, etc.