
Uploaded by
noam
2 SLIDES
166 VUES
20LIKES
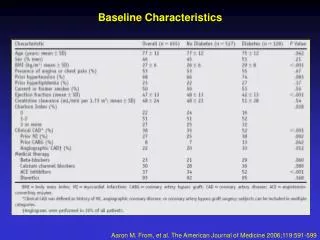
Baseline
DESCRIPTION
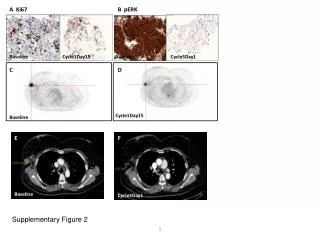
BTR 4.2%. BTR 3.4%. BTR 3.4%. WTR = 3.3-8.3 mmol/L, 60-150 mg/dL. Baseline. 3 Months. 6 Weeks. p = 0.035 for change from baseline to 3 months in WTR and ATR or ATR >240 mg/dl. Legend to the figure:
Download
1 / 2
Télécharger la présentation 
Baseline
An Image/Link below is provided (as is) to download presentation
Download Policy: Content on the Website is provided to you AS IS for your information and personal use and may not be sold / licensed / shared on other websites without getting consent from its author.
Content is provided to you AS IS for your information and personal use only.
Download presentation by click this link.
While downloading, if for some reason you are not able to download a presentation, the publisher may have deleted the file from their server.
During download, if you can't get a presentation, the file might be deleted by the publisher.
E N D
Presentation Transcript
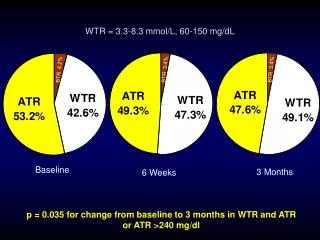
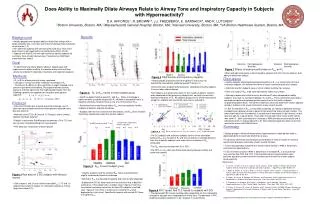
BTR 4.2% BTR 3.4% BTR 3.4% WTR = 3.3-8.3 mmol/L, 60-150 mg/dL Baseline 3 Months 6 Weeks p = 0.035 for change from baseline to 3 months in WTR and ATR or ATR >240 mg/dl
Legend to the figure: Target range glucose values with real-life use of CHMG: There was a significant increase in Within the Target Range (WTR) glycemia without any increase in hypoglycemia (BTR).


More Related