K-means Clustering
K-means Clustering. Given a data point v and a set of points X , define the distance from v to X d ( v, X ) as the (Euclidian) distance from v to the closest point from X . Given a set of n data points V ={v 1 …v n } and a set of k points X ,


K-means Clustering
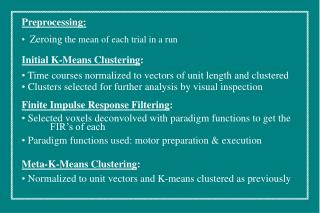
E N D
Presentation Transcript
K-means Clustering • Given a data pointv and a set of points X, define the distance from v to X d(v, X) as the (Euclidian) distance from v to the closest point from X. • Given a set of n data pointsV={v1…vn} and a set of k points X, define the Squared Error Distortion d(V,X) = ∑d(vi, X)2 / n 1 <i<n
K-Means Clustering • Input: A set, V, consisting of n points and a parameter k • Output: A set X consisting of k points (cluster centers) that minimizes the squared error distortion d(V,X) over all possible choices of X • K-means Clustering algorithm • Pick a number (K) of cluster centers • Assign every data point (e.g., gene) to its nearest cluster center • Move each cluster center to the mean of its assigned data points (e.g., genes) • Repeat 2-3 until convergence
1-Means Clustering Problem: an Easy Case • Input: A set, V, consisting of n points • Output: A single points x (cluster center) that minimizes the squared error distortion d(V,x) over all possible choices of x
1-Means Clustering Problem: an Easy Case • Input: A set, V, consisting of n points • Output: A single points x (cluster center) that minimizes the squared error distortion d(V,x) over all possible choices of x 1-Means Clustering problem is easy. However, it becomes very difficult (NP-complete) for more than one center. An efficient heuristic method for K-Means clustering is the Lloyd algorithm
K-Means Clustering • Arbitrarily assign the k cluster centers • while the cluster centers keep changing • Assign each data point to the cluster Ci corresponding to the closest cluster representative (center) (1 ≤ i ≤ k) • After the assignment of all data points, compute new cluster representatives according to the center of gravity of each cluster, that is, the new cluster representative is ∑v \ |C|for all v in C for every cluster C This clustering approach may lead to merely a locally optimal clustering.
x1 x2 x3 v: Data points X: Cluster centre v Iteration 0
x1 x2 x3 Iteration 1
x1 x2 x3 Iteration 2
x1 x2 x3 Iteration 3
Advantages Genes automatically assigned to clusters Disadvantages Must determine number of clusters before hand (solution: objective function to select optimum number of clusters) All genes forced into a cluster (solution: fuzzy c-means clustering and its versions) Clustering models can depend on starting locations of cluster centers (solution: multiple clusterings) K-means clustering summary
obj1 deals with inner space of a cluster, and try to make each cluster as compact as possible K-means clustering: Optimum number of clusters obj2 is defined to look at relationship between clusters, and tries to make clusters as far from each other as possible. Therefore, higher the value of obj2 the better the separation of the clusters. obj3 is combination of both obj1 and obj2
K-means clustering: Optimum number of clusters obj1 obj2 obj3
K-means clustering in MATLAB • IDX = KMEANS(X, K) partitions the points in the N-by-P data matrix • X into K clusters. This partition minimizes the sum, over all • clusters, of the within-cluster sums of point-to-cluster-centroid • distances. Rows of X correspond to points, columns correspond to • variables. KMEANS returns an N-by-1 vector IDX containing the • cluster indices of each point. By default, KMEANS uses squared • Euclidean distances. • KMEANS treats NaNs as missing data, and removes any rows of X that • contain NaNs. • [IDX, C] = KMEANS(X, K) returns the K cluster centroid locations in • the K-by-P matrix C. • [IDX, C, SUMD] = KMEANS(X, K) returns the within-cluster sums of • point-to-centroid distances in the 1-by-K vector sumD. • [IDX, C, SUMD, D] = KMEANS(X, K) returns distances from each point • to every centroid in the N-by-K matrix D.
K-means clustering in MATLAB • [ ... ] = KMEANS(..., 'PARAM1',val1, 'PARAM2',val2, ...) allows you to • specify optional parameter name/value pairs to control the iterative • algorithm used by KMEANS. • Parameters: ‘Distance’, 'Start‘, 'Replicates‘, 'EmptyAction‘, 'Display' • 'Distance' - Distance measure, in P-dimensional space, that KMEANS • should minimize with respect to. Choices are: • {'sqEuclidean'} - Squared Euclidean distance • 'cityblock' - Sum of absolute differences, a.k.a. L1 • 'cosine' - One minus the cosine of the included angle • between points (treated as vectors) • 'correlation' - One minus the sample correlation between • points (treated as sequences of values) • 'Hamming' - Percentage of bits that differ (only • suitable for binary data)
K-means clustering in MATLAB • 'Start' - Method used to choose initial cluster centroid positions, • sometimes known as "seeds". Choices are: • {'sample'} - Select K observations from X at random • 'uniform' - Select K points uniformly at random from • the range of X. Not valid for Hamming distance. • 'cluster' - Perform preliminary clustering phase on • random 10% subsample of X. This preliminary • phase is itself initialized using 'sample'. • matrix - A K-by-P matrix of starting locations. In • this case, you can pass in [] for K, and • KMEANS infers K from the first dimension of • the matrix. You can also supply a 3D array, • implying a value for 'Replicates' • from the array's third dimension
K-means clustering in MATLAB • 'Replicates' - Number of times to repeat the clustering, each with a new set of initial centroids [ positive integer | {1}] • 'Maxiter' - The maximum number of iterations [ positive integer | {100}] • 'EmptyAction' - Action to take if a cluster loses all of its member observations. Choices are: • {'error'} - Treat an empty cluster as an error • 'drop' - Remove any clusters that become empty, and • set corresponding values in C and D to NaN. • 'singleton' - Create a new cluster consisting of the one observation furthest from its centroid.
K-means clustering in MATLAB Practical applications - 1 Investigate the followings from MATLAB’s index menu - “cluster analysis – K-means clustering” - “clusters – gene expression data” Note that, in both applications, the K-means was run 5 times with the same number of clusters and resulted in different results due to random initialisation of the cluster centres. The outputs show that, for both problems (simple or complex), non-global minima do exist. Each of these five replicates began from a different randomly selected set of initial centroids. K-means then found two different local minima for the first application whereas five different local minima was identified for the yeast genes. However, the final solution that K-means returns is the one with the lowest total sum of distances, over all replicates.
K-means clustering in MATLAB Practical applications – 2 • (a) Using K-means clustering tool, cluster the genes into 16 and 25 sub-groups • (b) Identify a particular gene that can represent each cluster • A gene that is the closest to the centre of a particular cluster can be treated as the gene that characterises the cluster and represent the genes that belong to the cluster • (c) As the K-means clustering method attains initial centre values randomly and therefore is likely to produce different sets of profiles, try Task-(a) with two different initial centre sets and compare the profiles • Find out if there is any difference between genes that are found in Task-(b) to represent each cluster
You may start with the following small gene set and then work on the yeast data set t1 t2 t3 g1 10 8 10 g2 10 0 9 g3 4 8.5 3 g4 9.5 0.5 8.5 g5 4.5 8.5 2.5 g6 10.5 9 12 g7 5 8.5 11 g8 2.7 8.7 2 g9 9.7 2 9 g10 10.2 1 9.2