Understanding SUSHI Harvesting: Utilizing Use Data for Libraries
90 likes | 192 Vues
Uncover the significance of collecting use data in libraries and its diverse applications - from advocacy to purchasing decisions. Explore various ways to present use data, including charts and PivotCharts, derived from columnar data. Join Tansy Matthews, Associate Director at the Virtual Library of Virginia, in this informative webinar episode.

Understanding SUSHI Harvesting: Utilizing Use Data for Libraries
E N D
Presentation Transcript
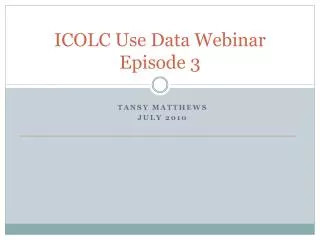
ICOLC Use Data WebinarEpisode 4 Tansy Matthews AUGUST (Ack!) 2010
First Questions about the SUSHI Harvester
Getting Philosophical • Fundamental question about collecting use data. • Why bother?
What we use it for Advocacy Bibliographic instruction Purchasing decisions (sometimes)
How we present it • Charts • PivotCharts • PivotCharts are made from PivotTables which are made from the columnar data we discussed in Episode 2 (when I was loopy)
For example… Tracking use by individual member or title
Cost per use Tracking cost per use (Not dealing with the ethical questions of whether or not this is useful, etc. We do it.)
Questions? Comments? Tansy Matthews Associate Director Virtual Library of Virginia tmatthe6@gmu.edu