Digital Representation of Audio Information
220 likes | 353 Vues
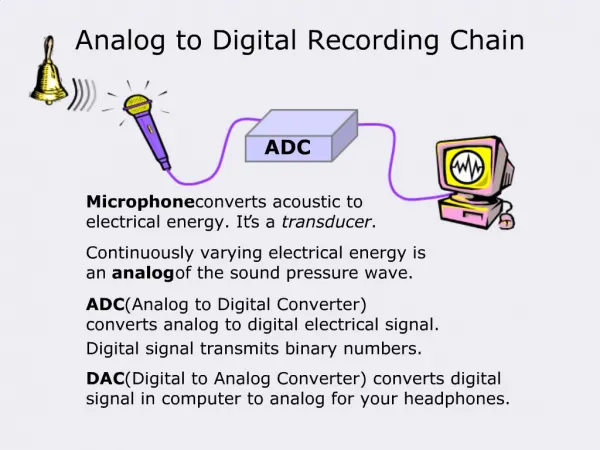
Digital Representation of Audio Information. Kevin D. Donohue Electrical Engineering University of Kentucky. 11 10 01 00. Elements of a DSP System. Discrete-time Signal. Digital Signal. Analog Signal. Coder. Quantizer. Processed Digital Signal. Processed Analog Signal.

Digital Representation of Audio Information
E N D
Presentation Transcript
Digital Representation of Audio Information Kevin D. DonohueElectrical EngineeringUniversity of Kentucky
11 10 01 00 Elements of a DSP System Discrete-time Signal Digital Signal Analog Signal Coder Quantizer Processed Digital Signal Processed Analog Signal Interpolating /Smoothing Computing /Decoding
Critical Audio Issues Trade-off between resources to store/transmit and quality of audio information • Sampling rate • Quantization level • Compression techniques
Sound and Human Perception • Signal fidelity does not need to exceed the sensitivity of the auditory system
Audible Frequency Range and Sampling Rate • Frequency range - 20 to 20,000 Hz • Audible intensities - threshold of hearing (1 Pico watt/meter2 corresponds to 0 db • Sample sweep constant intensity – 0 to 20 kHz in 10 seconds
Sampling Requirement • A bandlimited signal can be completely reconstructed from a set of discrete samples by low-pass filtering (or interpolating) a sequence of its samples, if the original signal was sampled at a rate greater than twice its highest frequency. • Aliasing errors occur when original signal contains frequencies greater than or equal to half the sampling rate. • Signal energy beyond 20 kHz is not audible, sampling rates beyond 40 kHz should capture almost all audible detail (no perceived quality loss).
Sampling Standards • CD quality samples at 44.1 kHz • DVD quality samples at 48 kHz • Telephone quality 8 kHz.
Bandwidth and Sampling Errors • Original Sound • Limited Bandwidth (LPF with 900 Hz cutoff) and sampled at 2 kHz • Original Sound sampled at 2 kHz (aliasing)
Dynamic Range and Audible Sound • Intensity changes less than 1 dB in intensity typically are not perceived by the human auditory system. • 25 tones at 1 kHz, decreasing in 3 dB increments • The human ear can detect sounds from 1x10-12 to 10 watts / meter2 (130 dB dynamic range)
Quantization Levels and Dynamic Range • An N bit word can represent 2N levels • For audio signal an N bit word corresponds to:Nx20xLog10(2) dB dynamic range • 16 bits achieve a dynamic range of about 96 dB. For every bit added, about 6 db is added to the dynamic range.
11 10 01 00 Analog Discrete Digital Quantization Error and Noise • Quantization has the same effects as adding noise to the signal: • Intervals between quantization levels are proportional to the resulting quantization noise. • For uniform quantization, the interval between signal levels is the maximum signal amplitude value divided by the number of quantization intervals.
Quantization Noise • Original CD clip quantized with 6 bits at original sampling frequency • 6 bit quantization at 2 kHz sampling
Encoding and Resources • Pulse code modulation (PCM) encodes each sample over uniformly spaced N bit quantization levels. • Number of bits required to represent C channels of a d second signal sampled at Fs with N bit quantization is: d*C*N*Fs + bits of header information • A 4 minute CD quality sound clip uses Fs=44.1 kHz, C=2, N=16 (assume no header): • File size = (4*60)*2*16*44.1k = 338.688Mb (or 42.336MBytes) • Transmission in real time requires a rate greater than 1.4 Mb/s
Compression Techniques • Compression methods take advantage of signal redundancies, patterns, and predictability via: • Efficient basis function transforms (wavelet and DCT) • LPC modeling (linear predictive coding) • CLPC (code excited linear prediction) • ADPCM (adaptive delta pulse code modulation) • Huffman encoding
File Formats • Critical parameters for data encoding describe how samples are stored in the file • signed or unsigned • bits per sample • byte order • number of channels and interleaving • compression parameters
File Formats • Extension, name origin variable parameters (fixed; Comments) • .Au or .snd next, sun rate, #channels, encoding, info string • .aif(f), AIFF apple, SGI rate, #channels, sample width, lots of info • .aif(f), AIFC apple, SGI same (extension of AIFF with compression) • .Voc Soundblaster rate (8 bits/1 ch; Can use silence deletion) • .Wav, wave Microsoft rate, #channels, sample width, lots of info • .sf IRCAM rate, #channels, encoding, info • None, HCOM Mac rate (8 bits/1 ch; Uses Huffman compression) • More details can be found at: • http://www.mcad.edu/guests/ericb/xplat.aud.html • http://www.intergate.bc.ca/business/gtm/music/sndweb.html#files • http://www.soften.ktu.lt/~marius/audio.descript.html • http://www.dspnet.com/TOL/newsletter/vol2_issue1/video_streaming.html
Subband Filtering and MPEG • Subband filtering transforms a block of time samples (frame) into a parallel set of narrow band signal
MPEG Layers • MPEG defines 3 layers for audio. Basic model is same, but codec complexity increases with each layer. • Divides data into frames, each of them contains 384 samples, 12 samples from each of the 32 filtered subbands. • Layer 1: DCT type filter with one frame and equal frequency spread per band. Psychoacoustic model only uses frequency masking (4:1). • Layer 2: use three frames in filter (before, current, next, a total of 1152 samples). This models some temporal masking (6:1). • Layer 3: better critical band filter is used (non-equal frequencies), psychoacoustic model includes temporal masking effects, takes into account stereo redundancy, and uses Huffman coder (12:1).
MPEG - Audio • Http://fas.sfu.Ca/cs/undergrad/CourseMaterials/cmpt479/material/notes/chap4/chap4.3/chap4.3.Html • Steps in algorithm: • Filters audio signal (e.g. 48 kHz sound) into frequency subbands that approximate the 32 critical bands --> sub-band filtering. • Determine amount of masking for each band caused by nearby band (this is called the psychoacoustic model). • If the power in a band is below the masking threshold, don't encode it. Otherwise, determine number of bits needed to represent the coefficient such that noise introduced by quantization is below the masking effect. • Format bitstream
Example • After analysis, the first levels of 16 of the 32 bands are these: • ---------------------------------------------------------------------- • Band 1 2 3 4 5 6 7 8 9 10 11 12 13 14 15 16 • Level (db) 0 8 12 10 6 2 10 60 35 20 15 2 3 5 3 1 • ---------------------------------------------------------------------- • If the level of the 8th band is 60db, • It gives a masking of 12 db in the 7th band, 15db in the 9th. • Level in 7th band is 10 db ( < 12 db ), so ignore it. • Level in 9th band is 35 db ( > 15 db ), so send it. • --> Can encode with up to 2 bits (= 12 db) of quantization error