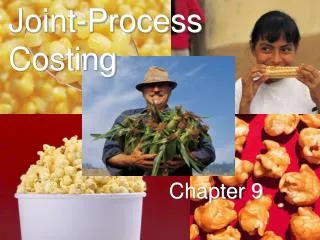
Joint-Process Costing
Joint product costing refers to the sharing of costs incurred during the production of multiple products derived from a single raw material input. In industries like oil refining or sawmills, several products are generated from one process. Key concepts include joint costs, split-off points, and the decision-making process regarding whether to sell products as-is or process them further. By analyzing relevant costs and potential revenues, businesses can optimize their profitability and inventory valuation. This guide covers the allocation of joint costs and the significance of market value in decision making.

Joint-Process Costing
E N D
Presentation Transcript
9 Joint-Process Costing
Joint Product Processes A number of products are producedfrom a single raw material input. Product 1 Single Input Product 2 Product 3
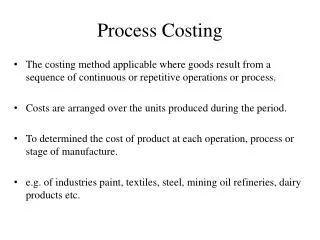
Joint Product Processes Concept: in some industries, a number of products are produced from a single raw material input. Key terms: • Joint products– products resulting from a process with a common input. • Split-off point– the stage of processing where joint products are separated. • Joint costs– costs of processing joint products prior to the split-off point. • Final product– ready for sale without further processing. • Intermediate product– requires further processing before sale.
Joint Product Processes Consider the following example of an oil refinery. We will assume only two products, gasoline and oil.
Final products Intermediate products Separate Processing Oil Final Sale SeparateProcessing Costs Separate Processing Final Sale Gasoline SeparateProcessing Costs Joint Product Processes Joint Costs Common Production Process Joint Input Split-Off Point
Forecast thesales price ofeach finalproduct. • Choose the setof productswith the overallmaximum profit. • Estimate coststo further processjoint products intofinal products. The Decision Challenge: Which Joint Products to Produce • Identify finalproducts possiblefrom the jointprocess. The usual objective in theproduction of joint productsis to maximize profits.
Decision to Sell Products at Split Off or Process Them Further • Joint product costs incurred prior to the split-off point are sunk costs— not affected by a decision to process further after the split-off point. • A product should be processed beyond the split-off point only if if the incremental revenue exceeds the incremental processing costs. Value is added only if theincremental value fromprocessing exceeds theincremental processing costs.
Decision to Sell Products at Split Off or Process Them Further • Sawmill, Inc. cuts logs from which unfinished lumber and wood chips are the joint products. • Unfinished lumber is sold “as is” or processed further into finished lumber. • Wood chips can also be sold “as is” for landscaping or processed further into 4 × 8 composition boards.
Decision to Sell Products at Split Off or Process Them Further Data about Sawmill’s joint products includes:
Decision to Sell Products at Split Off or Process Them Further
Decision to Sell Products at Split Off or Process Them Further Should we process the lumber further and sell the wood chips “as is?”
Reasons for Allocating Joint Costs • To measure performance based on earnings • To value inventory for financial statements • To estimate casualty losses • To determine and respond to rate regulation • To specify and resolve contractual interests and obligations
Monetarymeasure method Physicalmeasure method Joint costs are allocated based on a proportional measure (weight, volume, etc.) of the joint products at the split-off point. Joint costs areallocated based onthe relative valuesof the products at thesplit-off point. Joint Cost Allocation Methods
Allocating Joint Costs Jointcosts Allocation Allocation If we allocate the joint costs of raising an animal to the two productsbased on weight, which product would receive the largest cost allocation? Hamburger, because there is more of it.
Allocating Joint Costs Jointcosts Allocation Allocation If we allocate the joint costs of raising the animal to the two products based on sales value, would the steak receive a greater portion of the cost allocation? Yes, steak has a higher sales value than hamburger.
Joint Cost Allocation Methods Let’s look at an example illustrating the joint cost allocation methods.
Final Sales Value AddedProcessingCosts = – NRV Monetary Measure MethodNet Realizable Value If products require further processing beyond the split-off point before they are marketable,it may be necessary to estimate the net realizable value(NRV)at the split-off point.
Separate processing Oil Separate processing Gasoline Monetary Measure MethodNet Realizable Value Intermediate products Final products Joint costs Final sale Common production process Separateprocessing costs Joint input Final sale Split-off point Separateprocessing costs
Separate processing Oil Separate processing Gasoline Monetary Measure MethodNet Realizable Value Joint conversioncost = $225,000 Sales value$500,000 Common production process SeparateProcessing Costs$200,000 Joint material cost = $275,000 Sales value$1,200,000 Separateprocessing costs$500,000 Split-off point
Monetary Measure MethodNet Realizable Value The net realizable value method results inequal gross margin percentages for all products.
The physical measure method may be used when Output product prices are highly volatile. Many additional processes occur between the split-off point and the first point of marketability. Market prices are unavailable for products provided via cost-plus contracts. Physical Measure Method
Oil Physical Measure Method Joint costs 240,000 gallons Common production process Joint input 360,000 gallons Gasoline Split-off point
Oil Physical Measure Method Joint conversioncost = $225,000 240,000 gallons Common production process Joint material cost = $275,000 360,000 gallons Gasoline Split-off point
Physical Measure Method $275,000 joint material cost plus$225,000 joint conversion cost
Joint costs are truly common costs. It is impossible to separatethe portion of joint costsattributable to one producton a cause and effect basis. Which joint cost allocationmethod should we use? We get a different resultwith each method. Choosing Among Joint Cost Allocation Methods
That makes the choice of methods somewhat arbitrary. Regardless of the method we choose, we really need to be careful using allocated costs for decision-making purposes. Choosing Among Joint Cost Allocation Methods
Choosing Among Joint Cost Allocation Methods Choose the joint-cost allocation method that maximizes regulated profits or cost reimbursements. Do not base product or service production decisions on joint margins (I.e., after joint-cost allocation) unless the choice is in response to regulatory opportunities. Clearly define how to allocate joint costs in contractual agreements among parties that share outputs and joint costs of joint processes.
What Are By-Products? They are incidental to a production process. Their sales value is minimal. Examples Lumber production: wood chips Fertilizer production: methane gas Do not allocate joint costs to by-products
1 2 Accounting for By-Products Two commonly used methods of accounting for by-products are . . . • Realized Value ApproachBy-productNRVis treated asother revenue. • Net Realizable Value ApproachBy-productNRVisdeducted fromjoint production costs before allocation.
Relatively lowvalue or quantitywhen compared tomajor products By-products Accounting for By-Products Joint costs Majorproduct Common production process Joint input Majorproduct Split-off point
Separate processing By-products Accounting for By-Products Joint conversioncost = $50,000 Sales value$100,000 Majorproduct Common production process Sales value$70,000 Joint material cost = $50,000 Majorproduct Sales value$1,500 Split-off point Separateprocessing costs$400
Major product revenue = $100,000 + $70,000 Accounting for By-Products
By-product NRV = $1,500 – $400 = $1,100 Accounting for By-Products
Joint production costs = $50,000 material + $50,000 conversion Accounting for By-Products
The preceding example assumes the by-product has been sold. If the by-product is unsold . . . Using method2, the $1,100by-product NRVis deductedfrom finished goodsinventoryor work-in-process inventory if unfinished. Using method 1, the $1,100by-product NRVis placed in aby-product inventory account. By-Products: Some Complications
Waste is a by-product withnegativeNRV. (Cost of disposal exceeds sales value) Waste is disposed of at minimum cost. Waste disposal cost is charged tomanufacturing overheadand applied to otherproducts as part of themanufacturing overheadallocation process. Disposal of Scrap or Waste